This blog is co-authored by Noor Abani and Negin Raoof, Software Engineer, who jointly performed the benchmark, optimization and performance tuning experiments under the supervision of Nitin Kumar, Siphon team, AI Platform.
Our sincere thanks to Dhruv Goel and Uma Maheswari Anbazhagan from the HDInsight team for their collaboration.
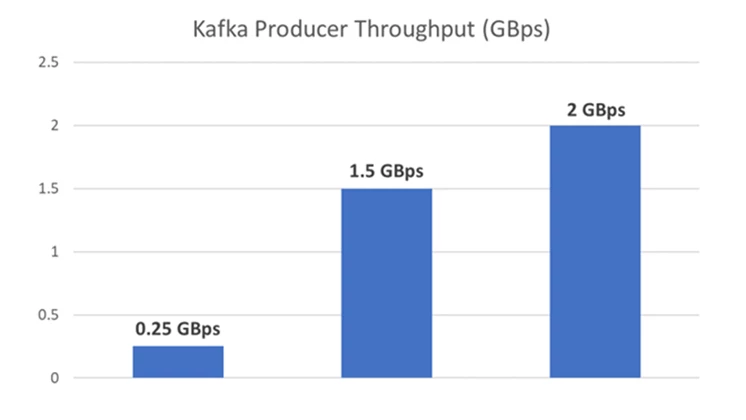
Figure 1: Producer throughputs for various scenarios. 2 GBps achieved on a 10 broker Kafka cluster.
In the current era, companies generate huge volumes of data every second. Whether it be for business intelligence, user analytics, or operational intelligence; ingestion, and analysis of streaming data requires moving this data from its sources to the multiple consumers that are interested in it. Apache Kafka is a distributed, replicated messaging service platform that serves as a highly scalable, reliable, and fast data ingestion and streaming tool. At Microsoft, we use Apache Kafka as the main component of our near real-time data transfer service to handle up to 30 million events per second.
In this post, we share our experience and learnings from running one of world’s largest Kafka deployments. Besides underlying infrastructure considerations, we discuss several tunable Kafka broker and client configurations that affect message throughput, latency and durability. After running hundreds of experiments, we have standardized the Kafka configurations required to achieve maximum utilization for various production use cases. We will demonstrate how to tune a Kafka cluster for the best possible performance.
Performance has two orthogonal dimensions – throughput and latency. From our experience, customer performance requirements fall in three categories A, B and C of the diagram below. Category A customers require high throughput (~1.5 GBps) and are tolerant to higher latency (< 250 ms). One such scenario is telemetry data ingestion for near real-time processes like security and intrusion detection applications. Category B customers have very stringent latency requirements (< 10 ms) for real-time processing, such as online spelling and grammar checks. Finally, Category C customers require both high throughput and low latency (~100 ms), but can tolerate lower data reliability, like service availability monitoring applications.
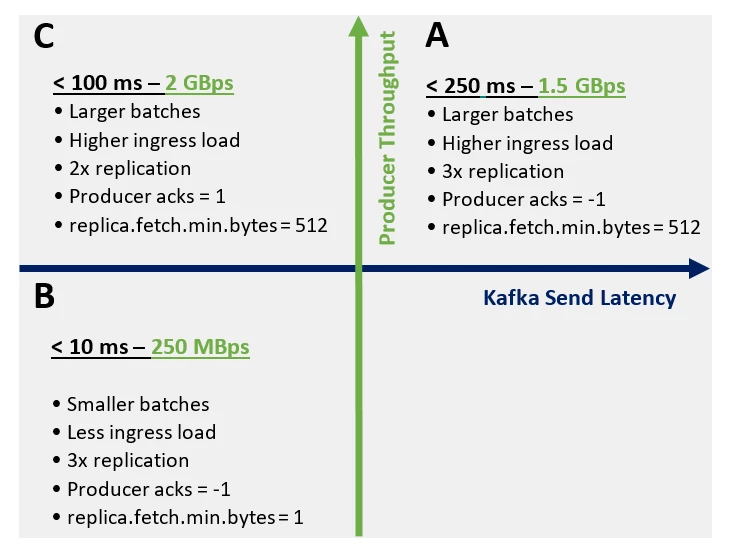
The graph above shows the maximum throughput we achieved in each case. Reliability is another requirement that has a trade-off against performance. Kafka provides reliability by replicating data and providing configurable acknowledgement settings. We quantify the performance impact that comes with these guarantees.
Our goal is to make it easier for anyone planning to run a production Kafka cluster to understand the effect of each configuration, evaluate the tradeoffs involved, tune it appropriately for their use case and get the best possible performance.
Siphon and Azure HDInsight
To build a compliant and cost-effective near real time publish-subscribe system that can ingest and process 3 trillion events per day from businesses like O365, Bing, Skype, SharePoint online, and more, we created a streaming platform called Siphon. Siphon is built for internal Microsoft customers on Azure cloud with Apache Kafka on HDInsight as its core component. Setting up and operating a Kafka cluster by purchasing the hardware, installing and tuning the bits and monitoring is very challenging. Azure HDInsight is a managed service with a cost-effective VM based pricing model to provision and deploy Apache Kafka clusters on Azure. HDInsight ensures that brokers stay healthy while performing routine maintenance and patching with a 99.9 percent SLA on Kafka uptime. It also has enterprise security features such as role-based access control and bring your own key (BYOK) encryption.
Benchmark setup

Traffic generator
To stress-test our system in general and the Kafka clusters specifically, we developed an application which constantly generates message batches of random bytes to a cluster’s front-end. This application spins 100 threads to send 1,000 messages of 1 KB random data to each topic, in 5 ms intervals. Unless explicitly mentioned otherwise, this is the standard application configuration.
Event Server setup
Event Server is used as a front-end web server which implements Kafka producer and consumer APIs. We provision multiple Event Servers in a cluster to balance the load and manage produce requests sent from thousands of client machines to Kafka brokers. We optimized Event Server to minimize the number of TCP connections to brokers by implementing partition affinity whereby each Event Server machine makes connections to a randomly selected partition’s leader, which gets reset after a fixed time interval. Each Event Server application runs in a docker container on scale-sets of Azure Standard F8s Linux VMs, and is allocated 7 CPUs and 12 GB of memory with a maximum Java heap size set to 9 GB. To handle the large amount of traffic generated by our stress tool, we run 20 instances of these Event Servers.
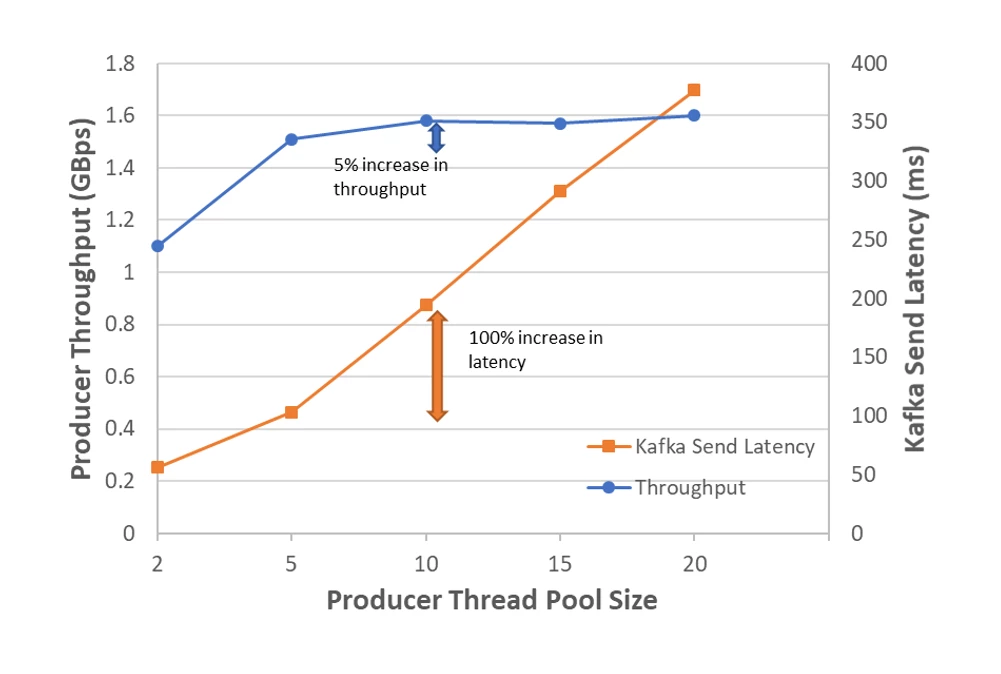
Event server also uses multiple sliding queues to control the number of outstanding requests from clients. New requests are queued to one of the multiple queues in an event server instance, which is then processed by multiple parallel Kafka producer threads. Each thread instantiates one producer. The number of sliding queues is controlled by thread pool size. When testing the producer performance for different thread pool sizes, we found out that adding too many threads can cause a processing overhead and increase Kafka request queue time and local processing time. Despite doubling the Kafka send latency, adding more than 5 threads did not increase the ingress throughput significantly. So, we chose 5 Kafka producer threads per event server instance.
Kafka Broker hardware
We used Kafka version 1.1 for our experiments. The Kafka brokers used in our tests are Azure Standard D4 V2 Linux VMs. We used 10 brokers with 8 cores and 28 GB RAM each. We never ran into high CPU utilization with this setup. On the other hand, the number of disks had a direct effect on throughput. We initially started by attaching 10 Azure Managed Disks to each Kafka broker. By default, Managed Disks support Locally-redundant storage (LRS), where three copies of data are kept within a single region. This introduces another level of durability, since write requests to an LRS storage account return successfully only after the data is written to all copies. Each copy resides in separate fault domains and update domains within a storage scale unit. This means that along with a 3x replication factor Kafka configuration, we are in essence ensuring 9x replication.
Consumers and Kafka Connect setup
In our benchmark, we used Kafka Connect as the connector service to consume data from Kafka. Kafka Connect is a built-in tool for producing and consuming Kafka messages in a reliable and scalable manner. For our experiments, we ran Null sink connectors which consume messages from Kafka, discard them and then commit the offsets. This allowed us to measure both producer and consumer throughput, while eliminating any potential bottlenecks introduced by sending data to specific destinations. In this setup, we ran Kafka Connect docker containers on 20 instances of Azure Standard F8s Linux VM nodes. Each container is allocated 8 CPUs and 10 GB Memory with maximum Java heap size of 7 GB.
Results
Producer configurations
The main producer configurations that we have found to have the most impact on performance and durability are the following:
- Batch.size
- Acks
- Compression.type
- Max.request.size
- Linger.ms
- Buffer.memory
Batch size
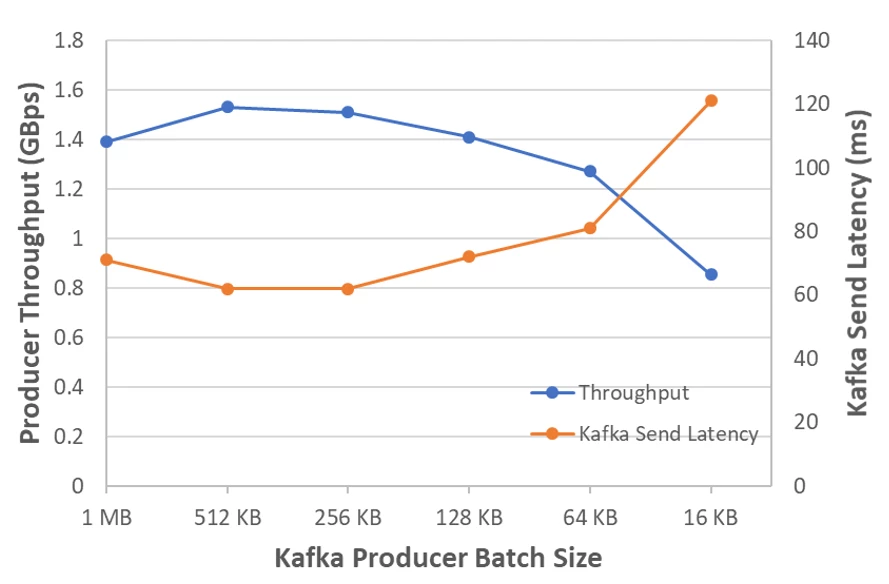
Each Kafka producer batches records for a single partition, optimizing network and IO requests issued to a partition leader. Therefore, increasing batch size could result in higher throughput. Under light load, this may increase Kafka send latency since the producer waits for a batch to be ready. For these experiments, we put our producers under a heavy load of requests and thus don’t observe any increased latency up to a batch size of 512 KB. Beyond that, throughput dropped, and latency started to increase. This means that our load was sufficient to fill up 512 KB producer batches quickly enough. But producers took a longer time to fill larger batches. Therefore, under heavy load it is recommended to increase the batch size to improve throughput and latency.
The Linger.ms setting also controls batching. It puts a ceiling on how long producers wait before sending a batch, even if the batch is not full. In low-load scenarios, this improves throughput by sacrificing latency. Since we tested Kafka under continuous high throughput, we didn’t benefit from this setting.
Another configuration we tuned to support larger batching was buffer.memory, which controls the amount of memory available for the producer for buffering. We increased this setting to 1 GB.
Producer required acks
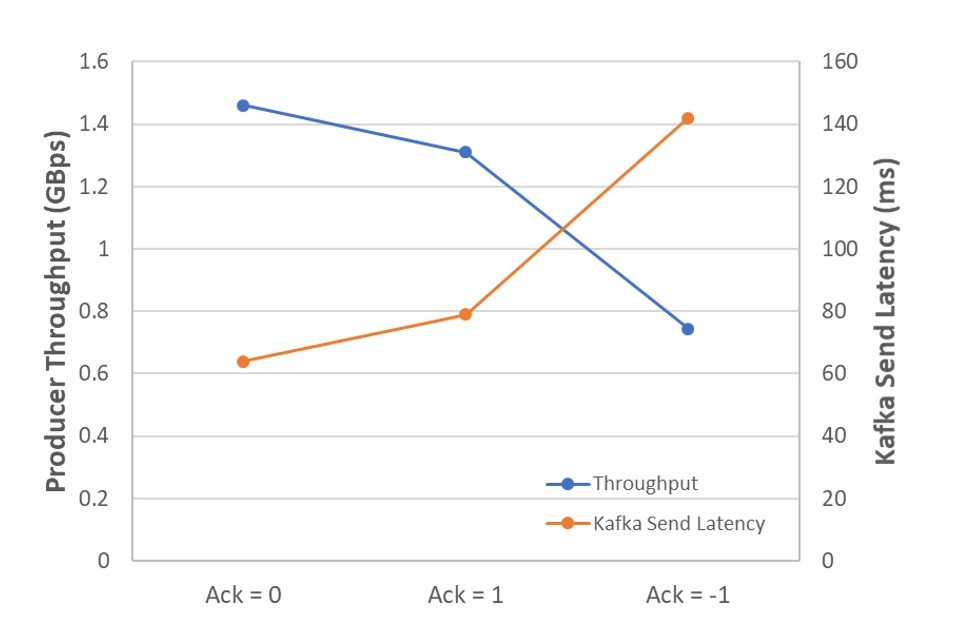
Producer required acks configuration determines the number of acknowledgments required by the partition leader before a write request is considered completed. This setting affects data reliability and it takes values 0, 1, or -1 (i.e. “all”).
To achieve highest reliability, setting acks = all guarantees that the leader waits for all in-sync replicas (ISR) to acknowledge the message. In this case, if the number of in-sync replicas is less than the configured min.insync.replicas, the request will fail. For example, with min.insync.replicas set to 1, the leader will successfully acknowledge the request if there is at least one ISR available for that partition. On the other end of the spectrum, setting acks = 0 means that the request is considered complete as soon as it is sent out by producer. Setting acks = 1 guarantees that the leader has received the message.
For this test, we varied the configuration between those three value. The results confirm the intuitive tradeoff that arises between reliability guarantees and latency. While ack = -1 provides stronger guarantees against data loss, it results in higher latency and lower throughput.
Compression
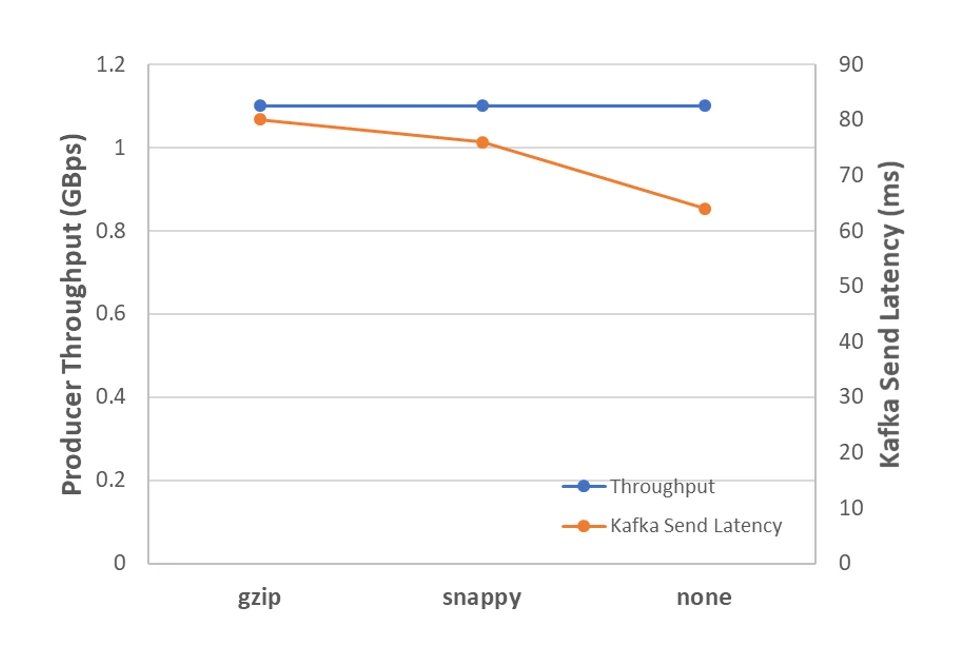
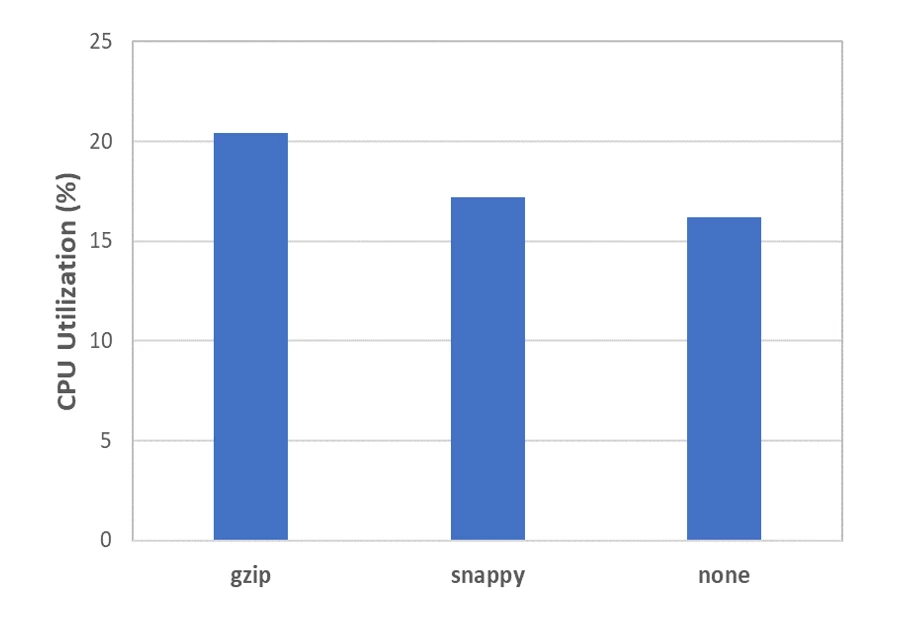
A Kafka producer can be configured to compress messages before sending them to brokers. The Compression.type setting specifies the compression codec to be used. Supported compression codecs are “gzip,” “snappy,” and “lz4.” Compression is beneficial and should be considered if there is a limitation on disk capacity.
Among the two commonly used compression codecs, “gzip” and “snappy,” “gzip” has a higher compression ratio resulting in lower disk usage at the cost of higher CPU load, whereas “snappy” provides less compression with less CPU overhead. You can decide which codec to use based on broker disk or producer CPU limitations, as “gzip” can compress data 5 times more than “snappy.”
Note that using an old Kafka producer (Scala client) to send to newer Kafka versions creates an incompatibility in message types structure (magic byte) which forces brokers to decompress and recompress before writing. This adds latency to message delivery and CPU overhead (almost 10 percent in our case) due to this extra operation. It is recommended to use the Java producer client when using newer Kafka versions.
Broker configurations
Number of disks
Storage disks have limited IOPS (Input/Output Operations Per Second) and read/write bytes per second. When creating new partitions, Kafka stores each new partition on the disk with fewest existing partitions to balance them across the available disks. Despite this, when processing hundreds of partitions replicas on each disk, Kafka can easily saturate the available disk throughput.
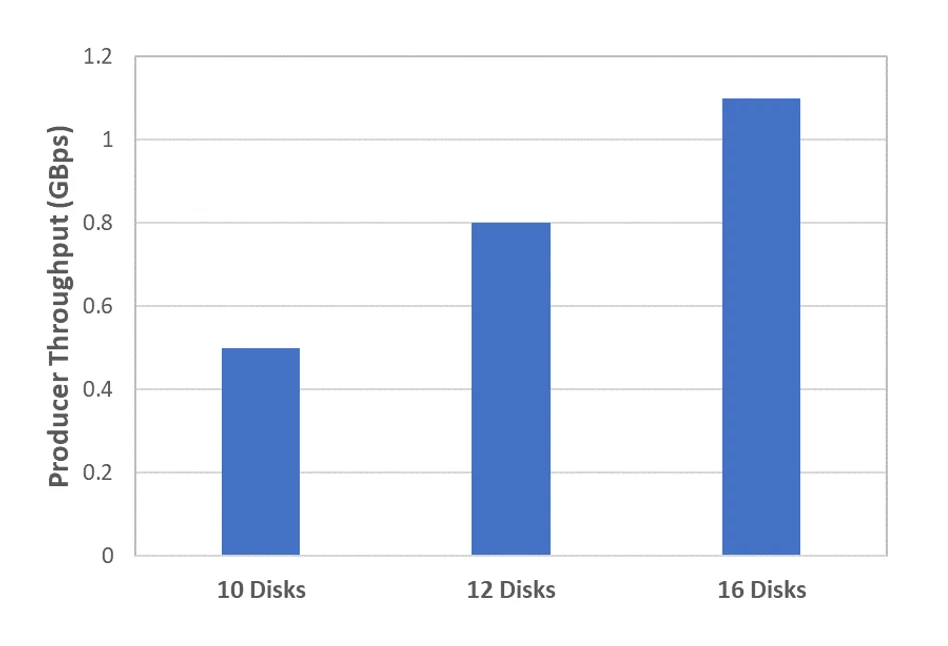
We used Azure standard S30 HDD disks in our clusters. In our experiments, we observed 38.5 MBps throughput per disk on average with Kafka performing multiple concurrent I/O operations per disk. Note that the overall write throughput includes both Kafka ingestion and replication requests.
We tested with 10, 12, and 16 attached disks per broker to study the effect on the producer throughput. The results show a correlation of increasing throughput with an increasing number of attached disks. We were limited by the number of disks that can be attached to one VM (16 disks maximum). Hence, adding more disks would need additional VMs, which would increase cost. We decided to continue with 16 standard HDDs per broker in the next experiments. Note that this experiment was specifically to observe the effect of the number of disks and did not include other configuration tuning done to optimize throughput. Hence, the throughputs mentioned in this section are lower than the values presented elsewhere in this post.
Number of topics and partitions
Each Kafka partition is a log file on the system, and producer threads can write to multiple logs simultaneously.
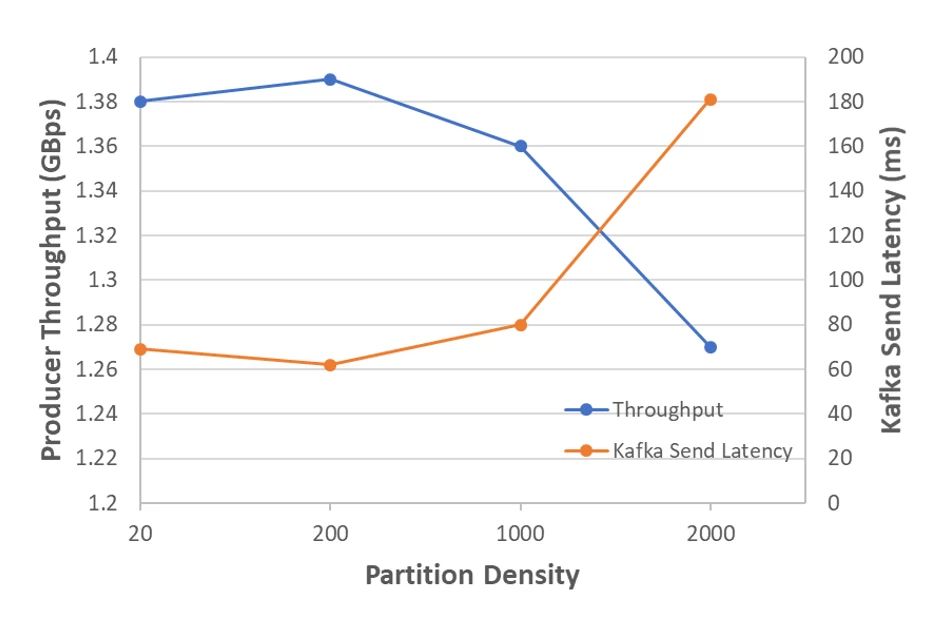
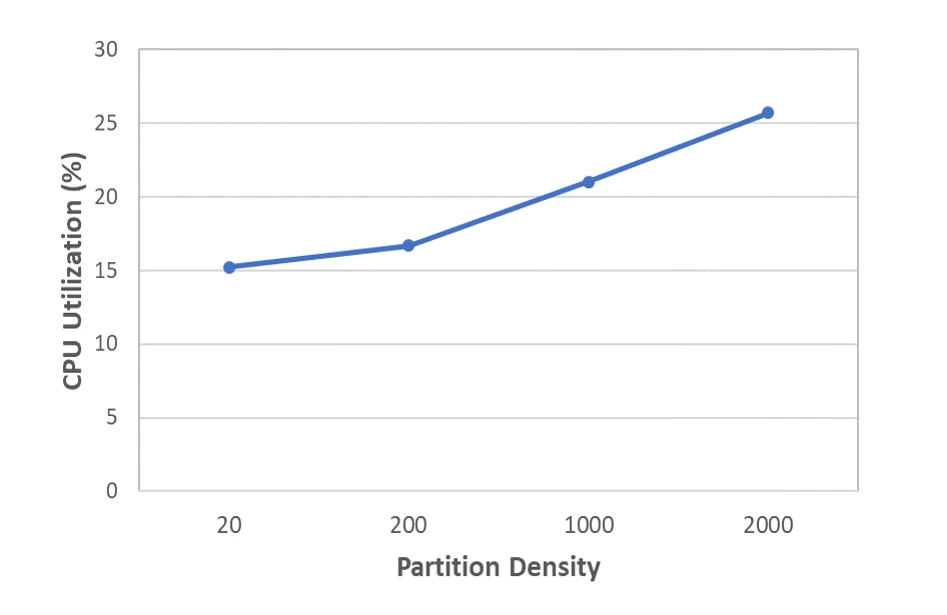
Similarly, since each consumer thread reads messages from one partition, consuming from multiple partitions is handled in parallel as well. In this experiment, we quantify the effect of partition density (i.e. the number of partitions per broker, not including replicas) on performance. Increasing the partition density adds an overhead related to metadata operations and per partition request/response between the partition leader and its followers. Even in the absence of data flowing through, partition replicas still fetch data from leaders, which results in extra processing for send and receive requests over the network. Therefore, we increased the number of I/O, network and replica fetcher threads to utilize the CPU more efficiently. Note that once CPU is fully utilized, increasing the thread pool sizes may not improve the throughput. You can monitor network and I/O processor idle time using Kafka metrics.
Moreover, observing Kafka metrics for request and response queue times enabled us to tune the size of Kafka thread pools. Allocating more I/O and network threads can reduce both the request and response queue wait times. Higher request local latency indicated that the disk couldn’t handle the I/O requests fast enough. The key Kafka configurations are summarized in the list below.
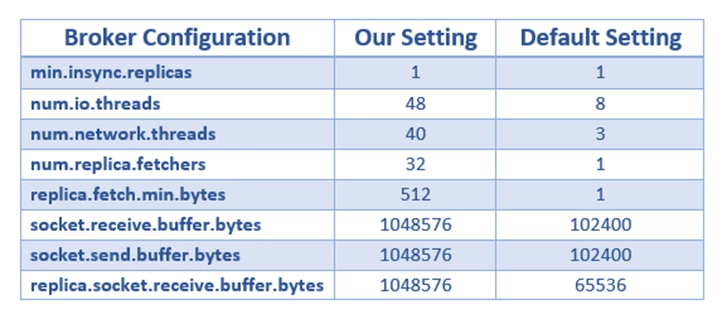
Kafka can handle thousands of partitions per broker. We achieved the highest throughput at 100 partitions per topic, i.e., a total of 200 partitions per broker (we have 20 topics and 10 brokers). The throughput decline exhibited for higher partition density corresponds to the high latency, which was caused by the overhead of additional I/O requests that the disks had to handle.
Also, keep in mind that increasing partition density may cause topic unavailability. In such cases, Kafka requires each broker to store and become the leader to a higher number of partitions. In the event of an unclean shutdown of such brokers, electing new leaders can take several seconds, significantly impacting performance.
Number of replicas
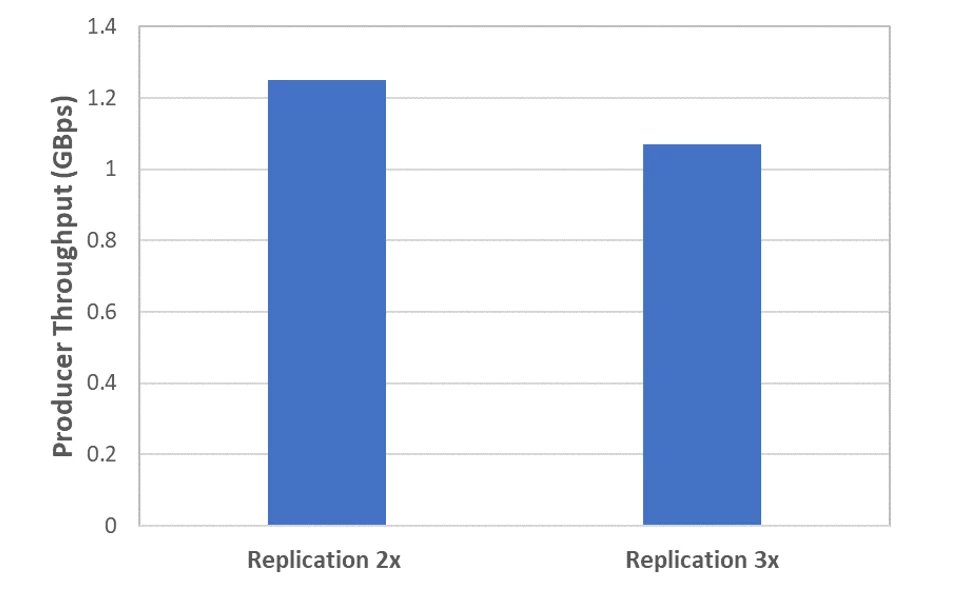
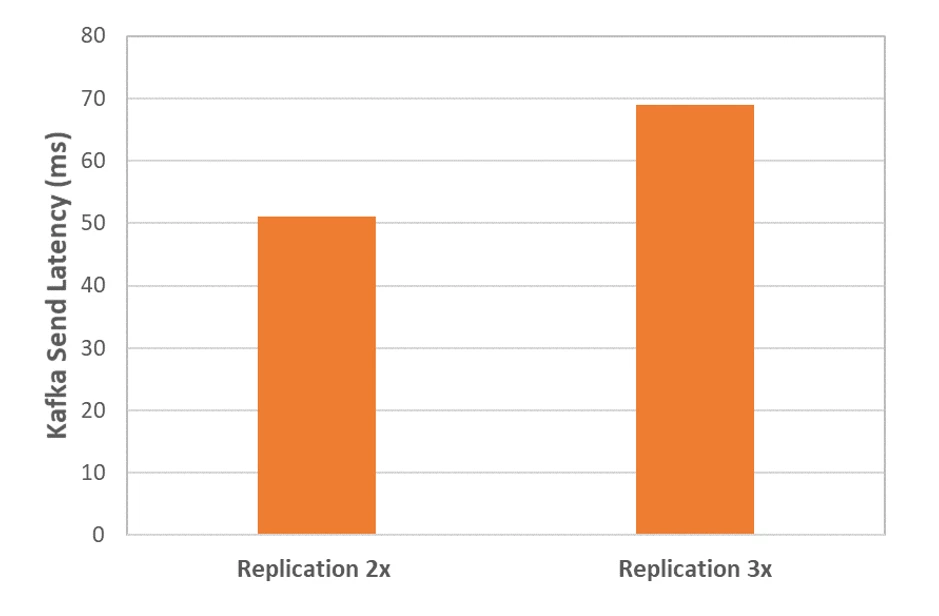
Replication is a topic level configuration to provide service reliability. In Siphon, we generally use 3x replication in our production environments to protect data in situations when up to two brokers are unavailable at the same time. However, in situations where achieving higher throughput and low latency is more critical than availability, the replication factor may be set to a lower value.
Higher replication factor results in additional requests between the partition leader and followers. Consequently, a higher replication factor consumes more disk and CPU to handle additional requests, increasing write latency and decreasing throughput.
Message size
Kafka can move large volumes of data very efficiently. However, Kafka sends latency can change based on the ingress volume in terms of the number of queries per second (QPS) and message size. To study the effect of message size, we tested message sizes from 1 KB to 1.5 MB. Note that load was kept constant during this experiment. We observed a constant throughput of ~1.5 GBps and latency of ~150 ms irrespective of the message size. For messages larger than 1.5 MB, this behavior might change.

Conclusion
There are hundreds of Kafka configurations that can be tuned to configure producers, brokers and consumers. In this blog, we pinpointed the key configurations that we have found to have an impact on performance. We showed the effect of tuning these parameters on performance metrics such as throughput, latency and CPU utilization. We showed that by having appropriate configurations such as partition density, buffer size, network and IO threads we achieved around 2 GBps with 10 brokers and 16 disks per broker. We also quantified the tradeoffs that arise between reliability and throughput with configurations like replication factor and replica acknowledgements.
