This is the fourth blog post in a four-part series on monitoring on Azure HDInsight. Monitoring on Azure HDInsight Part 1: An Overview discusses the three main monitoring categories: cluster health and availability, resource utilization and performance, and job status and logs. Part 2 is centered on the first topic, monitoring cluster health and availability. Part 3 discussed monitoring performance and resource utilization. This blog covers the third of those topics, workload metrics and logs, in more depth.
During normal operations when your Azure HDInsight clusters are healthy and performing optimally, you will likely focus your attention on monitoring the workloads running on your clusters and viewing relevant logs to assist with debugging. Azure HDInsight offers two tools that can be used to monitor cluster workloads: Apache Ambari and integration with Azure Monitor logs. Apache Ambari is included with all Azure HDInsight clusters and provides an easy-to-use web user interface that can be used to monitor the cluster and perform configuration changes. Azure Monitor collects metrics and logs from multiple resources such as HDInsight clusters, into an Azure Monitor Log Analytics workspace. An Azure Monitor Log Analytics workspace presents your metrics and logs as structured, queryable tables that can be used to configure custom alerts. Azure Monitor logs provide an excellent overall experience for monitoring workloads and interacting with logs, especially if you have multiple clusters.
Azure Monitor logs
Azure Monitor logs enable data generated by multiple resources such as HDInsight clusters to be collected and aggregated in one place to achieve a unified monitoring experience. As a prerequisite, you will need a Log Analytics workspace to store the collected data. If you have not already created one, you can follow these instructions for creating an Azure Monitor Log Analytics workspace. You can then easily configure an HDInsight cluster to send a host of logs and metrics to Azure Monitor Log Analytics.
HDInsight monitoring solutions
Azure HDInsight offers pre-made, monitoring dashboards in the form of solutions that can be used to monitor the workloads running on your clusters. There are solutions for Apache Spark, Hadoop, Apache Kafka, live long and process (LLAP), Apache HBase, and Apache Storm available in the Azure Marketplace. Please see our documentation to learn how to install a monitoring solution. These solutions are workload-specific, allowing you to monitor metrics like central processing unit (CPU) time, available YARN memory, and logical disk writes across multiple clusters of a given type. Selecting a graph takes you to the query used to generate it, shown in the logs view.
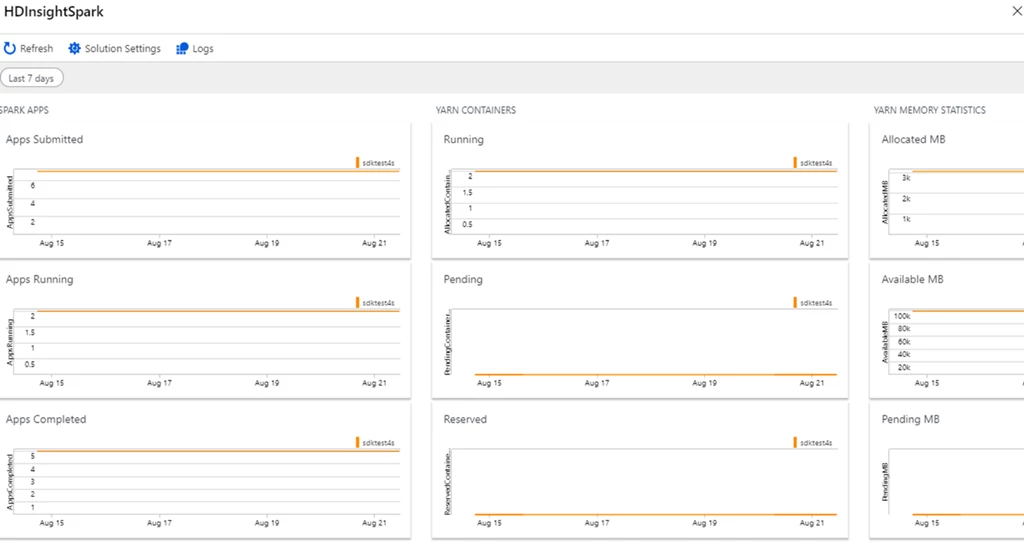
The HDInsight Spark monitoring solutions provide a simple pre-made dashboard where you can monitor workload-specific metrics for multiple clusters on a single pane of glass.
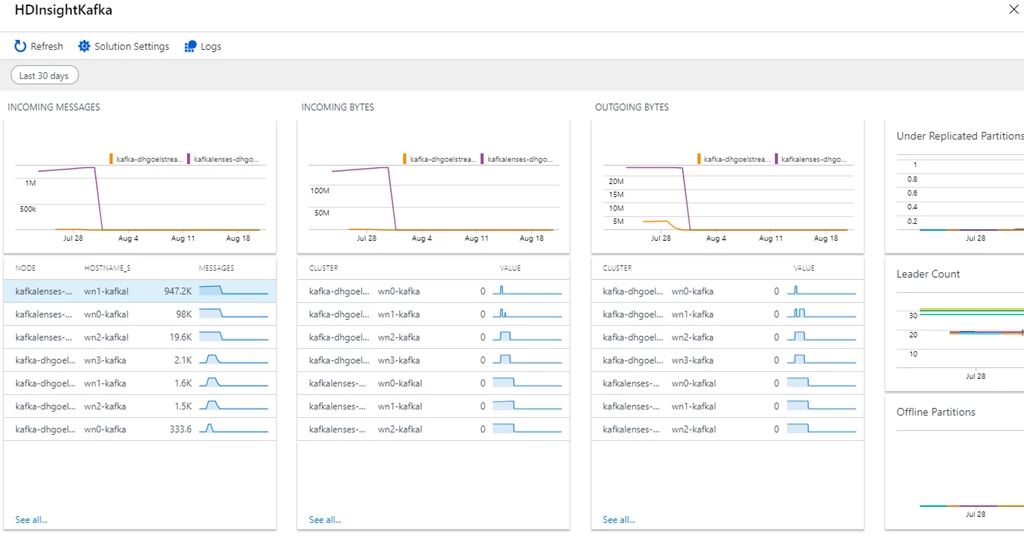
The HDInsight Kafka monitoring solution enables you to monitor all of your Kafka clusters on a single pane of glass.
Query using the logs blade
You can also use the logs view in your Log Analytics workspace to query the metrics and tables directly.
HDInsight clusters emit several workload-specific tables of logs, such as log_resourcemanager_CL, log_spark_CL, log_kafkaserver_CL, log_jupyter_CL, log_regionserver_CL, and log_hmaster_CL.
On the metrics side, clusters emit several metrics tables, including metrics_sparkapps_CL, metrics_resourcemanager_queue_root_CL, metrics_kafka_CL, and metrics_hmaster_CL. For more information, please see our documentation, Query Azure Monitor logs to monitor HDInsight clusters.
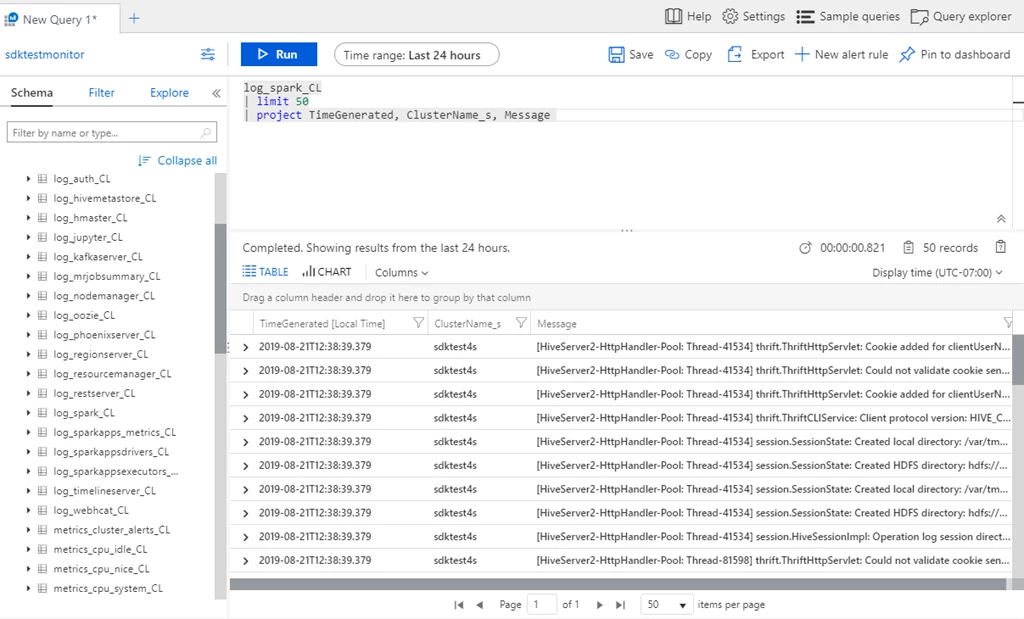
The Logs blade in a Log Analytics workspace lets you query collected metrics and logs across many clusters.
Azure Monitor alerts
You can also set up Azure Monitor alerts that will trigger when the value of a metric or the results of a query meet certain conditions. You can condition on a query returning a record with a value that is greater than or less than a certain threshold, or even on the number of results returned by a query. For example, you could create an alert to send an email if a Spark job fails or if a Kafka disk usage becomes over 90 percent full.
There are several types of actions you can choose to trigger when your alert fires such as an email, SMS, push notification, voice, an Azure Function, an Azure LogicApp, a webhook, an IT service management (ITSM), or an automation runbook. You can set multiple actions for a single alert, and find more information about these different types of actions by visiting our documentation, Create and manage action groups in the Azure Portal.
Finally, you can specify a severity for the alert in addition to the name. The ability to specify severity is a powerful tool that can be used when creating multiple alerts. For example, you could create an alert to raise a Sev 1 warning alert if a single head node becomes unavailable and another alert that raises a Sev 0 critical alert in the unlikely event that both head nodes go down. Alerts can be grouped by severity when viewed later.
Apache Ambari
The Apache Ambari dashboard provides links to several different views for monitoring workloads on your cluster.
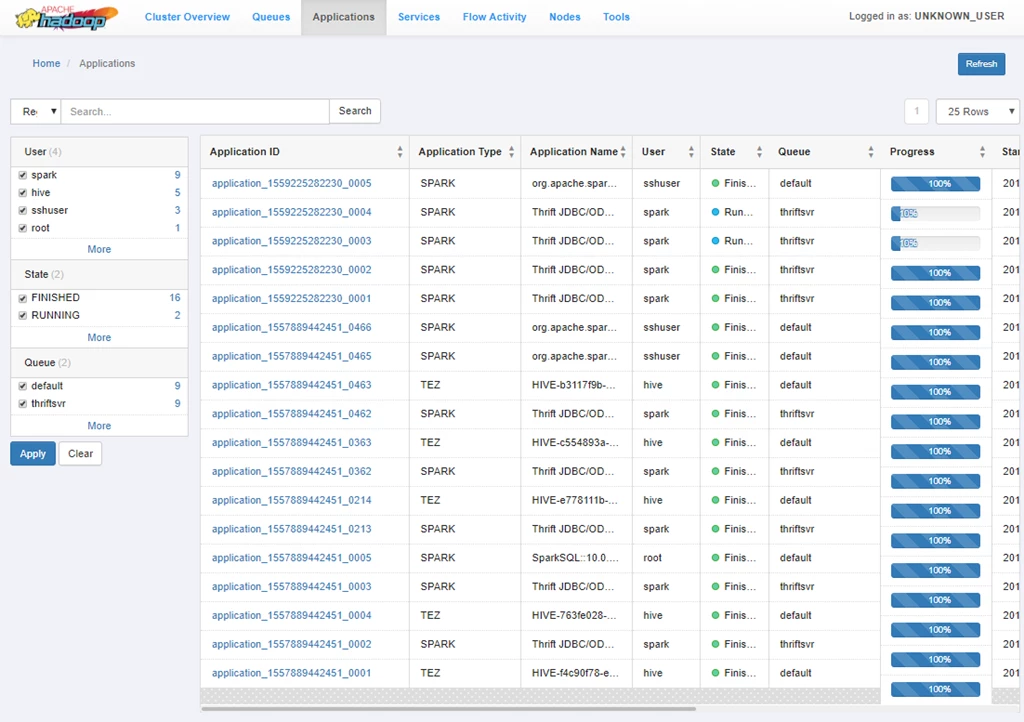
ResourceManager user interface
The ResourceManager user interface provides several views to monitor jobs on a YARN-based cluster. Here, you can see multiple views, including an overview of finished or running apps and their resource usage, a view of scheduled jobs by queue, and a list of job execution history and the status of each. You can click on an individual application ID to view more details about that job.
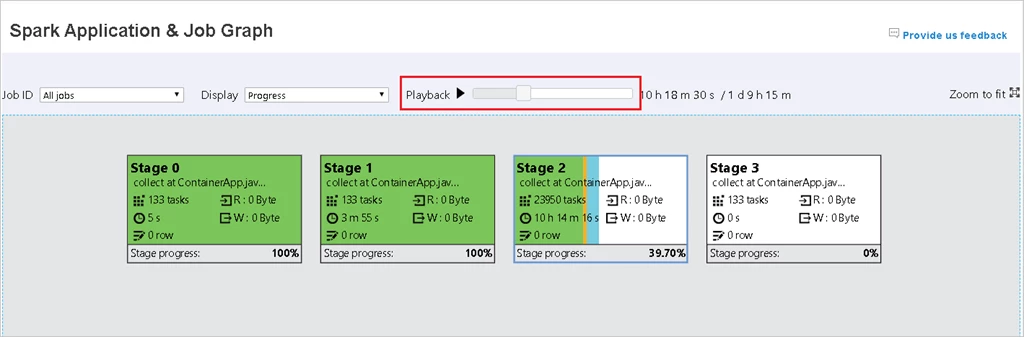
Spark History Server
The Apache Spark History Server shows detailed information for completed Spark jobs, allowing for easy monitoring and debugging. In addition to the traditional tabs across the top (jobs, stages, executors, etc.), you will find additional data, graph, and diagnostic tabs to help with further debugging.
Cluster logs
YARN log files are available on HDInsight clusters and can be accessed through the ResourceManager logs link in Apache Ambari. For more information about cluster logs, please see our documentation, Manage logs for an HDInsight cluster.
Next steps
If you haven’t read the other blogs in this series, you can check them out below:
- Monitoring on Azure HDInsight Part 1: An Overview
- Monitoring on Azure HDInsight Part 2: Cluster health and availability
- Monitoring on Azure HDInsight Part 3: Performance and resource utilization
About Azure HDInsight
Azure HDInsight is an easy, cost-effective, enterprise-grade service for open source analytics that enables customers to easily run popular open source frameworks including Apache Hadoop, Spark, Kafka, and others. The service is available in 36 regions and Azure Government and national clouds. Azure HDInsight powers mission-critical applications in a wide variety of sectors and enables a wide range of use cases including extract, transform, and load (ETL), streaming, and interactive querying.