Have you ever felt the need to diagnose a critical problem and you needed access to packet data from a virtual machine? What if you could capture the packet data from a virtual machine in just a few clicks? How about the ability to log flow data for Network Security Groups, visualize and interpret the information with a tooling platform of your choice?
With Azure Network Watcher, you can now access a plethora of logging and diagnostic capabilities that empower you with insights to understand your network performance and health. These capabilities are accessible via Portal, Power Shell, CLI, Rest API and SDK.
What does Network Watcher enable for you?
Topology
You can now view the network topology of your deployments with just a few clicks. For example, the figure below represents the network topology of a simple web application deployed on Azure. With Network Watcher, you can now visualize the complete network topology of your application.
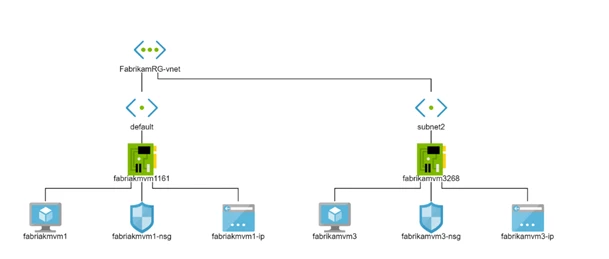
Sample topology view of a web application
IP flow verify
A common diagnostic need is to check whether a flow is allowed or denied to or from a virtual machine. Using “IP flow verify” you can now validate if a flow (combination of source IP, destination IP, source port, destination port and protocol) is allowed or denied. You will also be provided with the specific Network Security Group and security rule allowing or denying the flow in question.
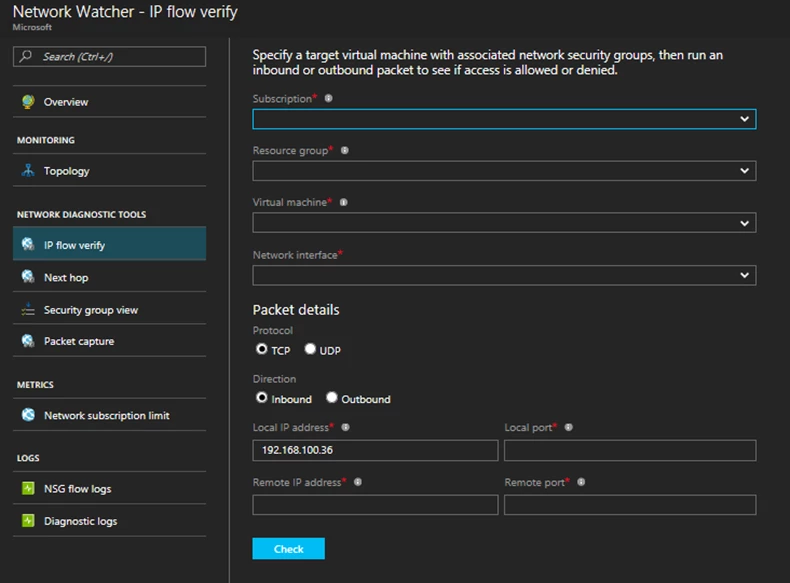
Validate IP flow from the Portal
Next hop
Typical issues with network connectivity is misconfiguration of user defined routes. Next hop provides the ability to get the next hop type and IP address based on a specified virtual machine, allowing you to investigate any route being black-holed and conditions caused by incorrect configuration.
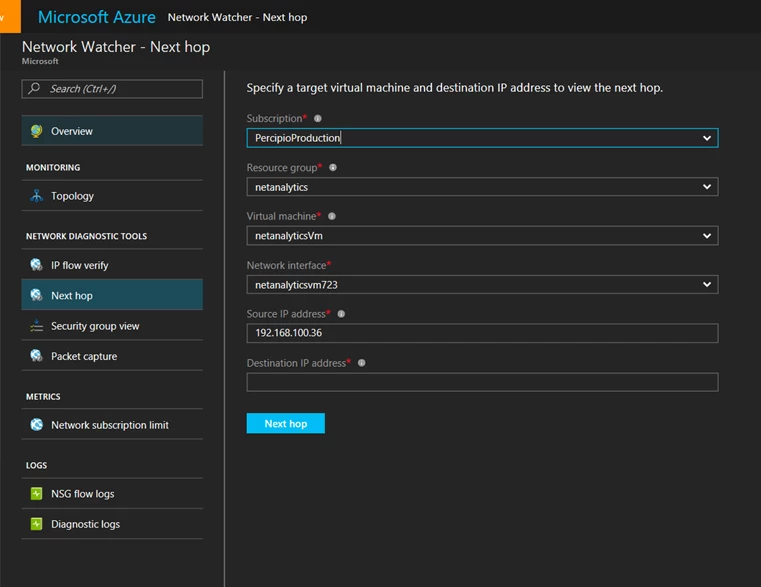 Get next hop from the Portal
Security Group view
Auditing your network security is vital for detecting network vulnerabilities and ensuring compliance with your IT security and regulatory governance model.
With Security Group view, you can retrieve the configured Network Security Group and security rules, as well as the effective security rules. With the list of rules applied, you can determine the ports that are open and assess network vulnerability.
In addition, your IT security and compliance governance can define prescriptive security rules that can now be programmatically audited using this feature.
As an example, PCI DSS compliance emphasizes the need to store logs and review logs that perform security functions such as firewalls. The primary intent for this is to identify anomalies and suspicious activity. With a combination of flow logs, Security Group view and Azure Automation, periodic and frequent audit can be done in a programmatic manner. You can detect and alert on suspicious and anomalous activity.
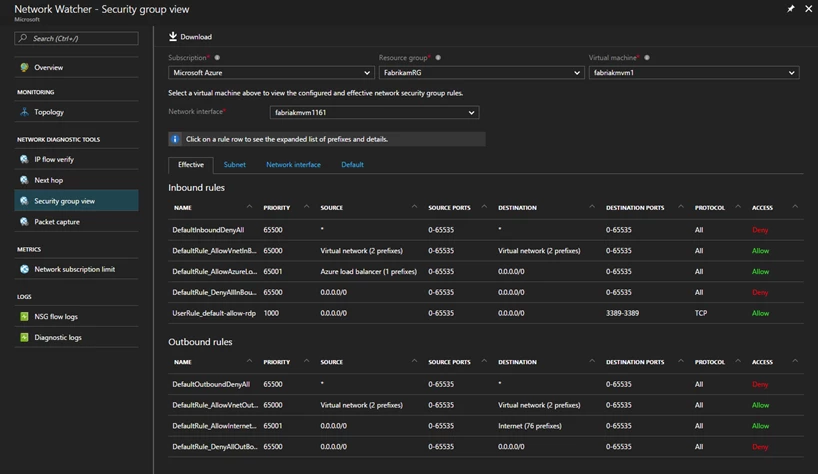
Network Security Group view for a virtual machine from the Portal
Packet capture
Capturing and accessing packet data enables you to address various needs from diagnosing a connectivity issue to network security and compliance. With Network Watcher, you can trigger packet capture on virtual machines. Applying advanced rule matching options, you can capture packets that have a specific source IP, destination IP, source port or destination port, or a byte offset from the start of the packet – even a combination of all the above. This feature is supported on both Windows and Linux virtual machines.
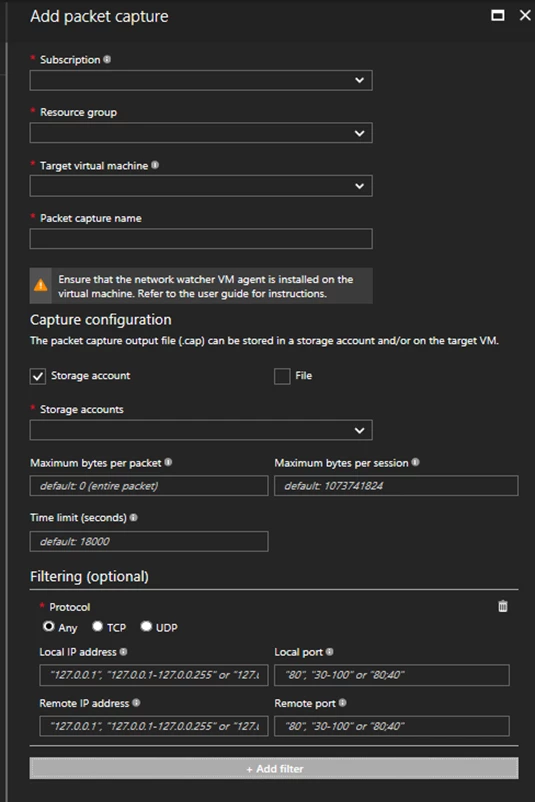
Configuring packet capture from the Portal
Network Subscription limits
You can now view the usage of network resources against the limits in your subscription.
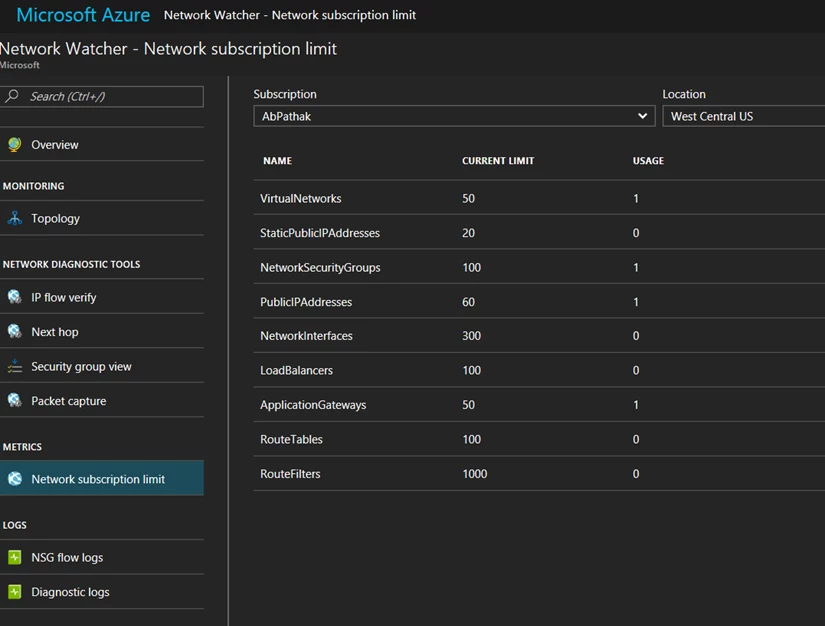 View limits for network resources in your subscription in a region
NSG flow logs
Flow data is a critical component for diagnosing and validating your Network Security Group configurations. You can now enable logging of NSG flow data that is allowed or denied per Network Security Group setting to help meet these needs. The NSG flow information includes timestamp, source IP, destination IP, source port, destination port and protocol, the Network Security Group and the security rule. This data can be ingested and visualized by Microsoft tools such as Power BI, as well as security information and event management tools provided by 3rd party partners and open source tools.
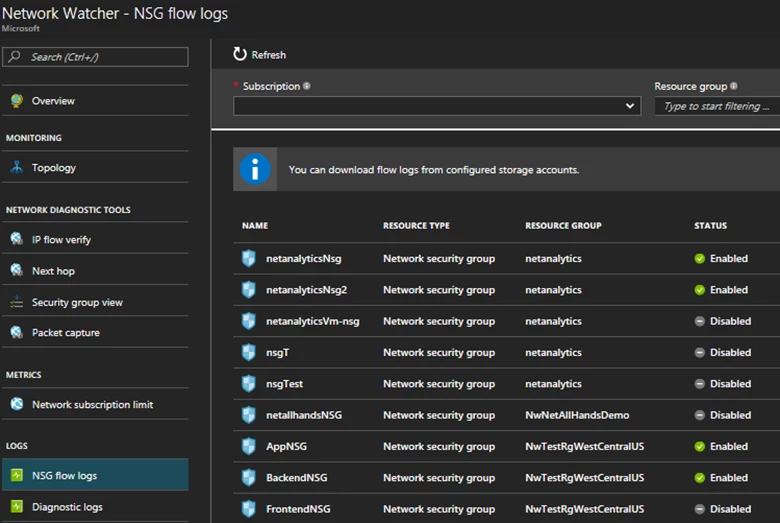
Configuring NSG flow logs from the Portal
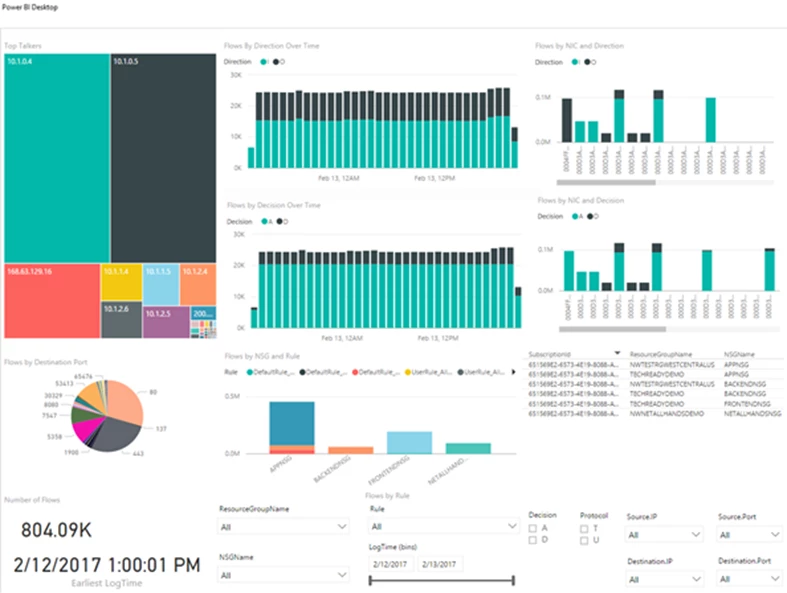
A sample Power BI dashboard with the ingested flow log
Diagnostic logs
You can now configure diagnostic logs for all the network resources in a resource group from a single pane.
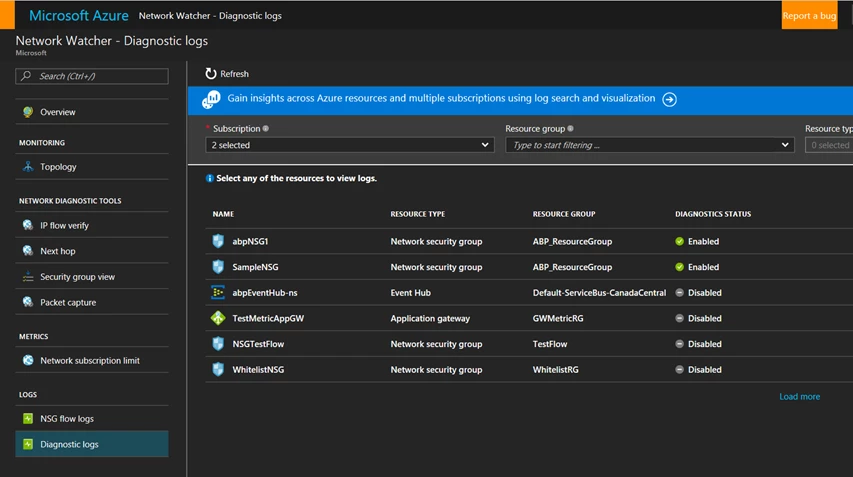
Configuring Diagnostic logs for network resources in a resource group
Virtual Network Gateway Connectivity Troubleshooting
A Virtual Network Gateway provides connectivity between your on-premises site and Azure VNets. Network Watcher will enable you to troubleshoot issues due to connectivity. A comprehensive suite of built-in tests are executed to isolate over fifteen different fault conditions and the results are logged in a customer specified storage. The log contains information such as connection status, bytes sent/received, IKE errors and WFP logs.
Integration with Azure Services
Using the native capabilities offered by Network Watcher, you can build powerful end to end network monitoring scenarios using Azure services like Azure Automation, Azure Functions and Azure Log Analytics.
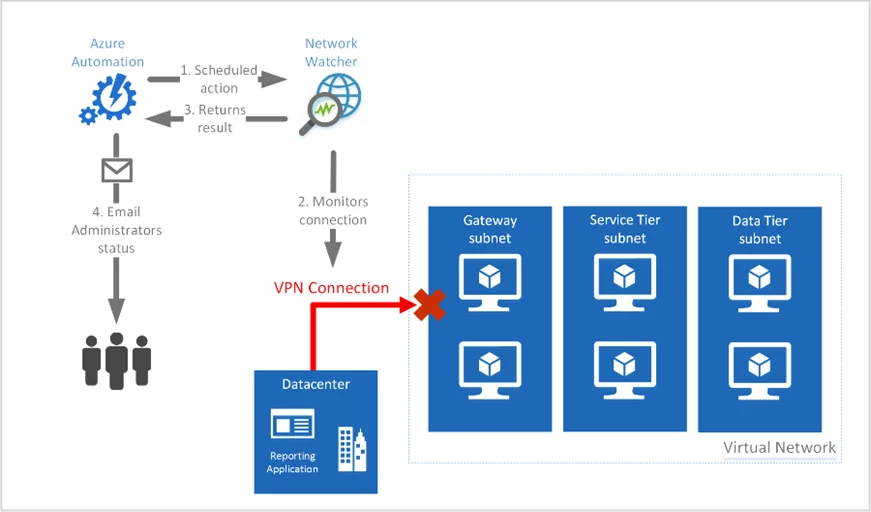
Proactive monitoring of VPN connection using Azure Automation and Network Watcher
Partners and ecosystem integration
We have partnered with the following 3rd party tool providers to integrate their products with Network Watcher and provide you with a holistic experience in monitoring your network in Azure.
Splunk have built an operational intelligence platform by turning data generated from Network Watcher into valuable insights.
Observable Networks have integrated the packet capture capability of Network Watcher with their ONA platform (Observable Network Appliance) to detect security issues in your virtual machine.
Bryan Doerr, CEO of Observable Networks said, “We’re excited that the results of our continuous and close collaboration with Microsoft are now reaching our mutual customers. Digital transformation and the fast-growing transition to cloud platforms, like Azure, are creating demand for new cloud native security services.”
Sumo Logic provides a machine data analytics platform that can ingest flow data for Network Security Groups to help you understand network vulnerabilities.
Kalyan Ramanathan, VP of Product Marketing at Sumo Logic said, “The cloud is changing the IT landscape. New business models, rapidly changing innovation and operations are driving a new set of needs. We are pleased to be teaming with Microsoft to further enhance the cloud experience for our mutual customers. Sumo Logic Machine Data analytics solution provides real-time operational insights into today’s modern applications with deep Microsoft Azure Integration, to help customers address the volume, variety and velocity of cloud generated data.”
Open source tools
Your network monitoring needs can be augmented by open source tools such as CapAnalysis, Suricata and the Elastic Stack (Elasticsearch, Logstash and Kibana). We hope you will be able to leverage and build on the sample integration scenarios for visualizing packet captures, network intrusion detection and visualizing flow logs.
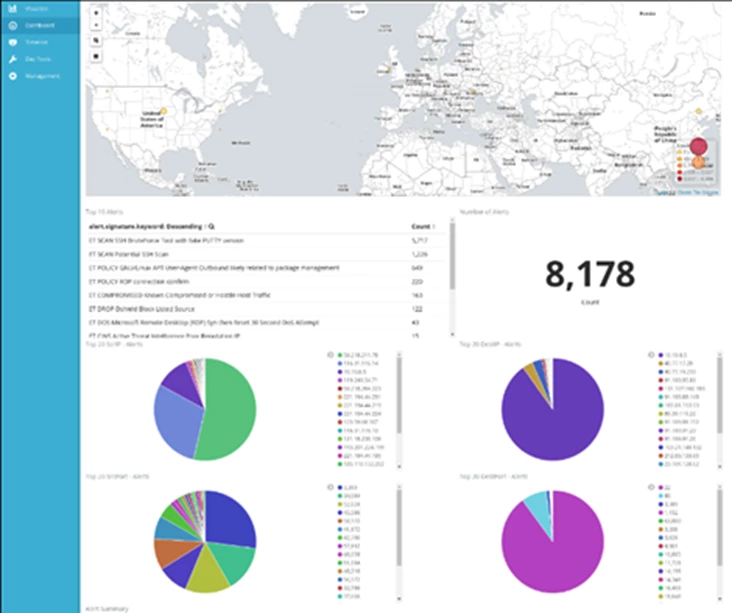
A sample dashboard highlighting network intrusion – integrating Network Watcher, Suricata and the Elastic Stack
Network Watcher availability
Azure Network Watcher is available now in preview in the following regions – US West Central, US North Central and US West. We are in the process of rolling out Network Watcher the rest of Azure regions around the world.
How much does it cost?
We understand the current capabilities in Network Watcher are critical to a variety of your needs from diagnostics to security and compliance. These capabilities will be available free with your subscription during the preview. Standard storage costs are applicable in certain cases.
Your requirements and requests for an integrated solution and tooling is at the center of building this advanced network monitoring capability in Azure. Your feedback from using Network Watcher is vital to help steer the product development and eco system growth.
Enjoy the preview!
