Organism, from Greek word Organismos, depicts a complex structure of living elements. But, what does a network have in common with organisms?
At Microsoft, we build and manage a hyper-scale global network that’s constantly growing and evolving. Supporting workloads such as Microsoft Azure, Bing, Dynamics, Office 365, OneDrive, Skype, Xbox, and soon LinkedIn, has stringent needs of reliability, security, and performance. Such needs make it imperative to continually monitor the pulse of the network, to detect anomalies, faults, and drive recovery at the millisecond level, much akin to monitoring a living organism.
Monitoring a large network that connects 38 regions, as of April 2017, hundreds of datacenters, thousands of servers with several thousand devices, and millions of components requires constant innovation and invention.
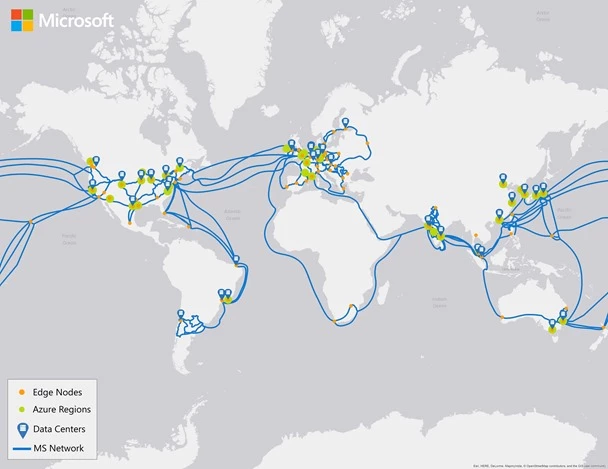
Figure 1. Microsoft global network
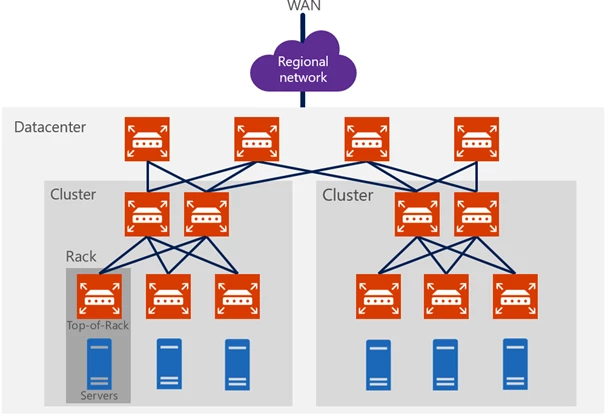
Figure 2. Illustration of a physical network in a datacenter
Four core principles drive the design and innovation of our monitoring services:
- Speed and accuracy: It’s imperative to detect failures at the sub-second level and drive recovery of the same.
- Coverage: From bit errors to bytes, to packets, to protocols, to components, to devices that make up the end-to-end network, our monitoring services must cover them all.
- Scale: The services must process petabytes of logs, millions of events, and thousands of correlations that are spread over several thousand miles of connectivity across the face of the planet.
- Optimize based on real user metrics: Our monitoring services must use metrics from a network topology level—within a rack, to a cluster, to a datacenter, to a region, to the WAN and the edge—and they must have the capability to zoom in and out.
We built innovations to proactively detect and localize a network issue, including PingMesh and NetBouncer. These services are always on and monitor the pulse of our network for latency and packet drops.
PingMesh uses lightweight TCP probes (consuming negligible bandwidth) for probing thousands of peers for latency measurement (RTT, or round trip time) and detects whether the issue is related to the physical network. RTT measurement is a good tool for detecting network reachability and packet-level latency issues.
After a latency deviation or packet drop is discovered, Netbouncer’s machine learning algorithms are then used to filter out transient issues, such as top-of-rack reboots for an upgrade. After completing temporal analysis in which we look at historical data and performance, we can confidently classify the incident as a network issue and accurately localize the faulty component. After the issue is localized, we can auto-mitigate it by rerouting the impacted traffic, and then either rebooting or removing the faulty component. In the following figure, green, yellow, or red visualize network latency ranges at the 99th percentile between a source-destination rack-pair.
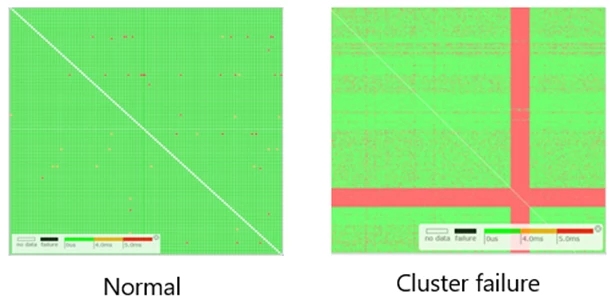
Figure 3. Examples of network latency patterns for known failure modes
In some customer incidents, the incident might need deeper investigation by an on-call engineer to localize and find the root cause. We needed a troubleshooting tool to efficiently capture and analyze the life of a packet through every network hop in its path. This is a difficult problem because of the necessary specificity and scale for packet-level analysis in our datacenters, where traffic can reach hundreds of terabits per second. This motivated us to develop a service called Everflow—it’s used to troubleshoot network faults using packet-level analysis. Everflow can inject traffic patterns, mirror specific packet headers, and mimic the customer’s network packet. Without Everflow, it would be hard to recreate the specific path taken by a customer’s packet; therefore, it would be difficult to accurately localize the problem. The following figure illustrates the high-level architecture of Everflow.
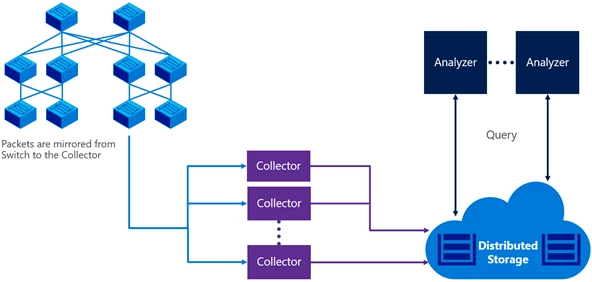
Figure 4. Packet-level telemetry collection and analytics using Everflow
Everflow is one of the tools used to monitor every cable for frame check sequence (FCS) errors. The optical cables can get dirty from human errors like bending or bad placement, or simply aging of the cable. The following figure shows examples of cable bending and cable placed near fans that can cause an FCS error on this link.
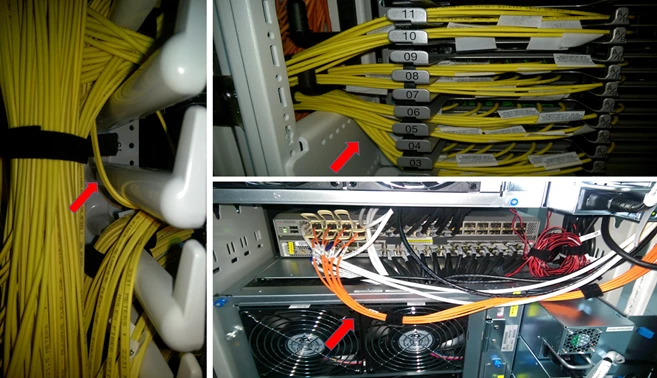
Figure 5. Examples of cable bending, and cable placed near the fans that can cause an FCS error on this link
We currently monitor every cable and allow only one error for every billion packets sent, and we plan to further reduce this threshold to ensure link quality for loss-sensitive traffic across millions of physical cables in each datacenter. If the cable has a higher error rate, we automatically shut down any links with these errors. After the cable is cleaned or replaced, Everflow is used to send guided probes to ensure that the link quality is acceptable.
Beyond the datacenter, supporting critical customer scenarios on the most reliable cloud requires observing network performance end-to-end from Internet endpoints. The Azure WAN evolved to build a service called the Map of the Internet that monitors Internet performance and customer experience in real time. This system can disambiguate between expected client performance across wired and wireless connections, separates sustained issues from transient ones, and provides visibility into any customer perspective on demand. For example, it helps us to answer questions like, “Are customers in Los Angeles seeing high RTT on AT&T?”, “Is Taipei seeing increased packet loss through HiNet to Hong Kong?”, and “Is Bucharest seeing reliability issues to Amsterdam?” We use this service to proactively and reactively intervene on impact or risks to customer experiences and quickly correlate them to the scenario, network, and location at fault. This data also triggers automated response and traffic engineering to really minimize impact or mitigate ahead of time whenever possible.
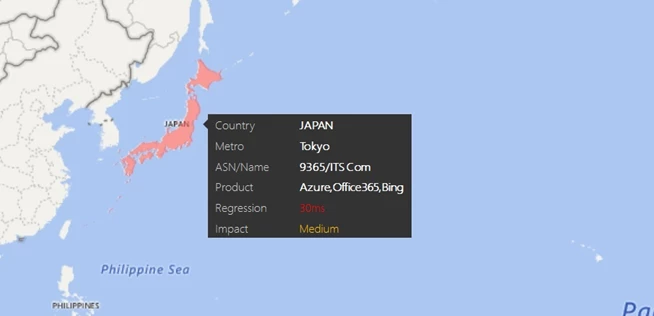
Figure 6. Example of latency degradation alert with a peering partner
The innovation built to monitor our datacenters, and its connectivity is also leveraged to provide insights to our customers.
Typically, customers use our network services via software abstractions. Such abstractions, including virtual networks, virtual network interface cards, and network access control lists, hide the complexity and intricacies of the datacenter network. We recently launched Azure Network Watcher, a service to provide visibility and diagnostic capability of the virtual/logical network and related network resources.
Using Network Watcher, you can visualize the topology of your network, understand performance metrics of the resources deployed in the topology, create packet captures to diagnose connectivity issues, and validate the security perimeter of your network to detect vulnerabilities and for compliance/audit needs.
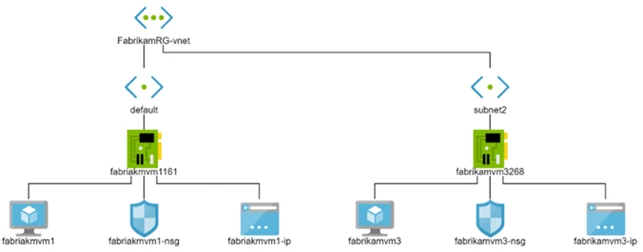
Figure 7. Topology view of a customer network
The following figure shows how a remote packet capture operation can be performed on a virtual machine.
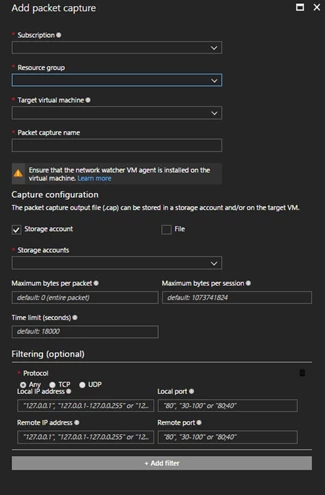
Figure 8. Variable packet capture in a virtual machine
Building and operating the world’s most reliable and hyper-scale cloud is underpinned by the need to proactively monitor and detect network anomalies and take corrective action—much akin to monitoring a living organism. As the pace, scale, and complexity of the datacenters evolve, new challenges and opportunities emerge, paving the way for continuous innovation. We’ll continue to invest in networking monitoring and automatic recovery, while also sharing our innovations with customers to also help them manage their virtual networks.
References
PingMesh: Guo, Chuanxiong, Lihua Yuan, Dong Xiang, Yingnong Dang, Ray Huang, Dave Maltz, Zhaoyi Liu, et al. “Pingmesh: A large-scale system for data center network latency measurement and analysis.” ACM SIGCOMM Computer Communication Review 45, no. 4 (2015): 139-152.
Everflow: Zhu, Yibo, Nanxi Kang, Jiaxin Cao, Albert Greenberg, Guohan Lu, Ratul Mahajan, Dave Maltz, et al. “Packet-level telemetry in large datacenter networks.” In ACM SIGCOMM Computer Communication Review, vol. 45, no. 4, pp. 479-491. ACM, 2015.
Read more
To read more posts from this series please visit:
