This post was co-authored by Dan Russ, Associate Director, and Sacha Abinader, Managing Director from Accenture.
The year 2022 was a notable one in the history of our climate—it stood as the fifth warmest year ever recorded1. An increase in extreme weather conditions, from devastating droughts and wildfires to relentless floods and heat waves, made their presence felt more than ever before—and 2023 seems poised to shatter still more records. These unnerving circumstances demonstrate the ever-growing impact of climate change that we’ve come to experience as the planet continues to warm.
Microsoft’s sustainability journey
At Microsoft, our approach to mitigating the climate crisis is rooted in both addressing the sustainability of our own operations and in empowering our customers and partners in their journey to net-zero emissions. In 2020, Microsoft set out with a robust commitment: to be a carbon-negative, water positive, and zero-waste company, while protecting ecosystems, all by the year 2030. Three years later, Microsoft remains steadfast in its resolve. As part of these efforts, Microsoft has launched Microsoft Cloud for Sustainability, a comprehensive suite of enterprise-grade sustainability management tools aimed at supporting businesses in their transition to net-zero.
Moreover, our contribution to several global sustainability initiatives has the goal of benefiting every individual and organization on this planet. Microsoft has accelerated the availability of innovative climate technologies through our Climate Innovation Fund and is working hard to strengthen our climate policy agenda. Microsoft’s focus on sustainability-related efforts forms the backdrop for the topic tackled in this blog post: our partnership with Accenture on the application of AI technologies toward solving the challenging problem of methane emissions detection, quantification, and remediation in the energy industry.
“We are excited to partner with Accenture to deliver methane emissions management capabilities. This combines Accenture’s deep domain knowledge together with Microsoft’s cloud platform and expertise in building AI solutions for industry problems. The result is a solution that solves real business problems and that also makes a positive climate impact.”—Matt Kerner, CVP Microsoft Cloud for Industry, Microsoft.
Why is methane important?
Methane is approximately 85 times more potent than carbon dioxide (CO2) at trapping heat in the atmosphere over a 20-year period. It is the second most abundant anthropogenic greenhouse gas after CO2, accounting for about 20 percent of global emissions.
The global oil and gas industry is one of the primary sources of methane emissions. These emissions occur across the entire oil and gas value chain, from production and processing to transmission, storage, and distribution. The International Energy Agency (IEA) estimates that it is technically possible to avoid around 75 percent of today’s methane emissions from global oil and gas operations. These statistics drive home the importance of addressing this critical issue.
Microsoft’s investment in Project Astra
Microsoft has signed on to the Project Astra initiative—together with leading energy companies, public sector organizations, and academic institutions—in a coordinated effort to demonstrate a novel approach to detecting and measuring methane emissions from oil and gas production sites.
Project Astra entails an innovative sensor network that harnesses advances in methane-sensing technologies, data sharing, and data analytics to provide near-continuous emissions monitoring of methane across oil and gas facilities. Once operational, this kind of smart digital network would allow producers and regulators to pinpoint methane releases for timely remediation.
Accenture and Microsoft—The future of methane management
Attaining the goal of net-zero methane emissions is becoming increasingly possible. The technologies needed to mitigate emissions are maturing rapidly, and digital platforms are being developed to integrate complex components. As referenced in Accenture’s recent methane thought leadership piece, “More than hot air with methane emissions”. What is needed now is a shift—from a reactive paradigm to a preventative one—where the critical issue of leak detection and remediation is transformed into leak prevention by leveraging advanced technologies.
Accenture’s specific capabilities and toolkit
To date, the energy industry’s approach to methane management has been fragmented and comprised of a host of costly monitoring tools and equipment that have been siloed across various operational entities. These siloed solutions have made it difficult for energy companies to accurately analyze emissions data, at scale, and remediate those problems quickly.
What has been lacking is a single, affordable platform that can integrate these components into an effective methane emissions mitigation tool. These components include enhanced detection and measurement capabilities, machine learning for better decision-making, and modified operating procedures and equipment that make “net-zero methane” happen faster. These platforms are being developed now and can accommodate a wide variety of technology solutions that will form the digital core necessary to achieve a competitive advantage.
Accenture has created a Methane Emissions Monitoring Platform (MEMP) that facilitates the integration of multiple data streams and embeds key methane insights into business operations to drive action (see Figure 1 below).
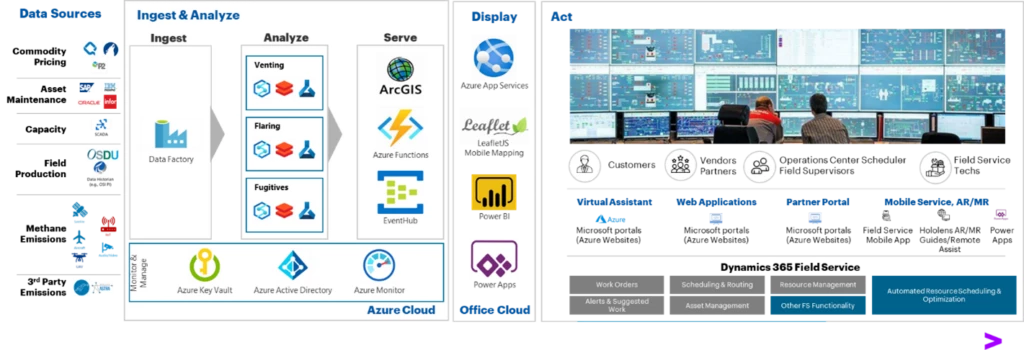
Figure 1: Accenture’s Methane Emissions Monitoring Platform (MEMP).
The cloud-based platform, which runs on Microsoft Azure, enables energy companies to both measure baseline methane emissions in near real-time and detect leaks using satellites, fixed wing aircraft, and ground level sensing technologies. It is designed to integrate multiple data sources to optimize venting, flaring, and fugitive emissions. Figure 2 below illustrates the aspirational end-to-end process incorporating Microsoft technologies. MEMP also facilitates connectivity with back-end systems responsible for work order creation and management, including the scheduling and dispatching of field crews to remediate specific emission events.
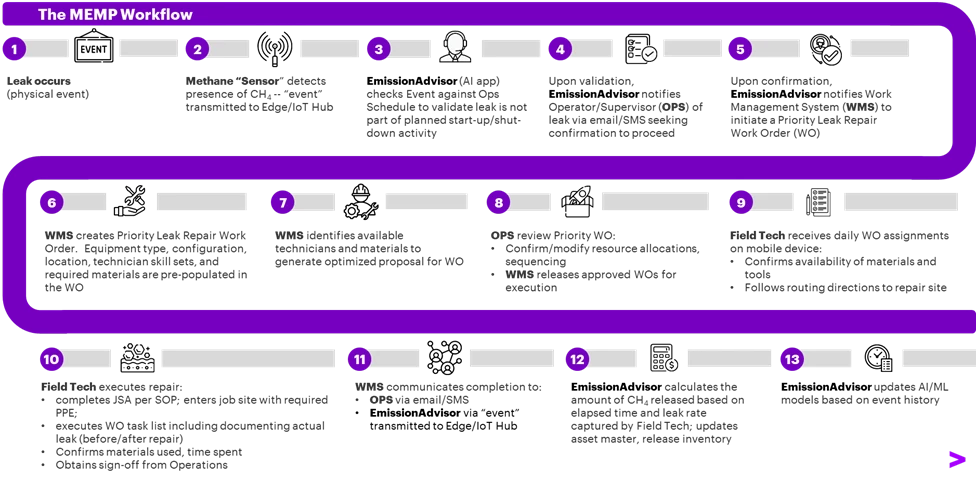
Figure 2: The Methane Emissions Monitoring Platform Workflow (aspirational).
Microsoft’s AI tools powering Accenture’s Methane Emissions Monitoring Platform
Microsoft has provided a number of Azure-based AI tools for tackling methane emissions, including tools that support sensor placement optimization, digital twin for methane Internet of Things (IoT) sensors, anomaly (leak) detection, and emission source attribution and quantification. These tools, when integrated with Accenture’s MEMP, allow users to monitor alerts in near real-time through a user-friendly interface, as shown in Figure 3.
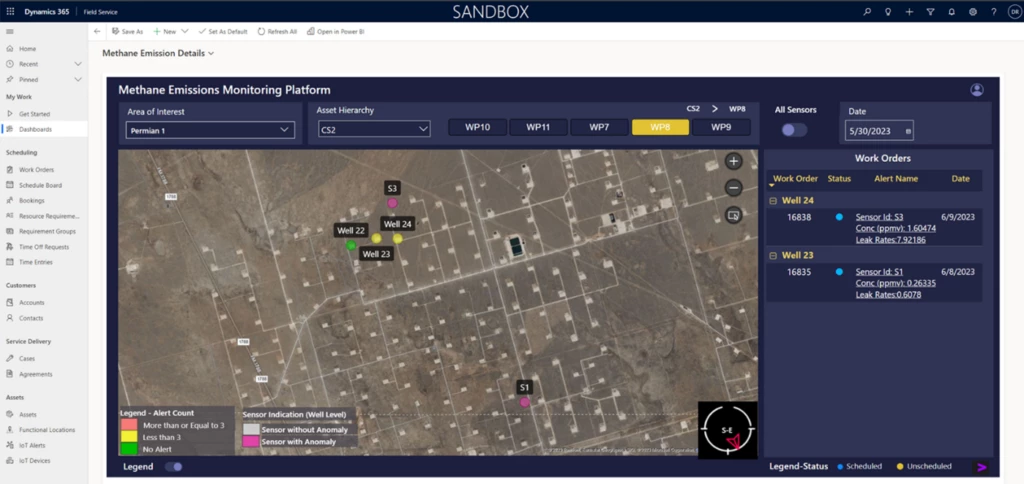
Figure 3: MEMP Landing Page visualizing wells, IoT sensors, and Work Orders.
“Microsoft has developed differentiated AI capabilities for methane leak detection and remediation, and is excited to partner with Accenture in integrating these features onto their Methane Emissions Monitoring Platform, to deliver value to energy companies by empowering them in their path to net-zero emissions”—Merav Davidson, VP, Industry AI, Microsoft.
Methane IoT sensor placement optimization
Placing sensors in strategic locations to ensure maximum potential coverage of the field and timely detection of methane leaks is the first step towards building a reliable end-to-end IoT-based detection and quantification solution. Microsoft’s solution for sensor placement utilizes geospatial, meteorological, and historical leak rate data and an atmospheric dispersion model to model methane plumes from sources within the area of interest and obtain a consolidated view of emissions. It then selects the best locations for sensors using either a mathematical programming optimization method, a greedy approximation method, or an empirical downwind method that considers the dominant wind direction, subject to cost constraints.
In addition, Microsoft provides a validation module to evaluate the performance of any candidate sensor placement strategy. Operators can evaluate the marginal gains offered by utilizing additional sensors in the network, through sensitivity analysis as shown in Figure 4 below.
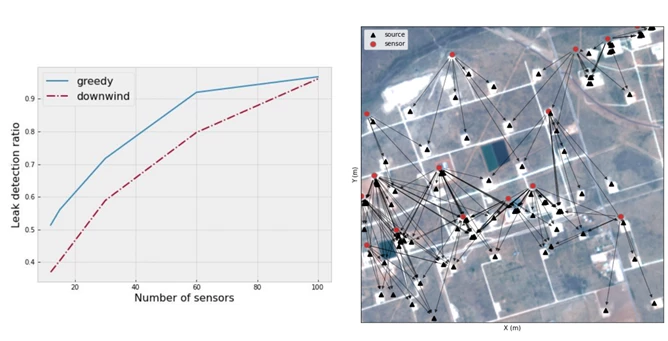
Figure 4: Left: Increase in leak coverage with a number of sensors. By increasing the number of sensors that are available for deployment, the leak detection ratio (i.e., the fraction of detected leaks by deployed sensors) increases. Right: Source coverage for 15 sensors. The arrows map each sensor (red circles) to the sources (black triangles) that it detects.
End-to-end data pipeline for methane IoT sensors
To achieve continuous monitoring of methane emissions from oil and gas assets, Microsoft has implemented an end-to-end solution pipeline where streaming data from IoT Hub is ingested into a Bronze Delta Lake table leveraging Structured Streaming on Spark. Sensor data cleaning, aggregation, and transformation to algorithm data model are done and the resultant data is stored in a Silver Delta Lake table in a format that is optimized for downstream AI tasks.
Methane leak detection is performed using uni- and multi-variate anomaly detection models for improved reliability. Once a leak has been detected, its severity is also computed, and the emission source attribution and quantification algorithm then identifies the likely source of the leak and quantifies the leak rate.
This event information is sent to the Accenture Work Order Prioritization module to trigger appropriate alerts based on the severity of the leak to enable timely remediation of fugitive or venting emissions. The quantified leaks can also be recorded and reported using tools such as the Microsoft Sustainability Manager app. The individual components of this end-to-end pipeline are described in the sections below and illustrated in Figure 5.
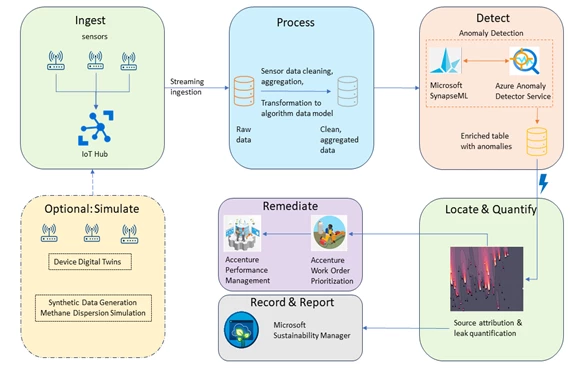
Figure 5: End-to-end IoT data pipeline that runs on Microsoft Azure demonstrating methane leak detection, quantification, and remediation capabilities.
Digital twin for methane IoT sensors
Data streaming from IoT sensors deployed in the field needs to be orchestrated and reliably passed to the processing and AI execution pipeline. Microsoft’s solution creates a digital twin for every sensor. The digital twin comprises a sensor simulation module that is leveraged in different stages of the methane solution pipeline. The simulator is used to test the end-to-end pipeline before field deployment, reconstruct and analyze anomalous events through what-if scenarios and enable the source attribution and leak quantification module through a simulation-based, inverse modeling approach.
Anomaly (leak) detection
A methane leak at a source could manifest as an unusual rise in the methane concentration detected at nearby sensor locations that require timely mitigation. The first step towards identifying such an event is to trigger an alert through the anomaly detection system. A severity score is computed for each anomaly to help prioritize alerts. Microsoft provides the following two methods for time series anomaly detection, leveraging Microsoft’s open-source SynapseML library, which is built on the Apache Spark distributed computing framework and simplifies the creation of massively scalable machine learning pipelines:
- Univariate anomaly detection: Based on a single variable, for example, methane concentration.
- Multivariate anomaly detection: Used in scenarios where multiple variables, including methane concentration, wind speed, wind direction, temperature, relative humidity, and atmospheric pressure, are used to detect an anomaly.
Post-processing steps are implemented to reliably flag true anomalous events so that remedial actions can be taken in a timely manner while reducing false positives to avoid unnecessary and expensive field trips for personnel. Figure 6 below illustrates this feature in Accenture’s MEMP: the ‘hover box” over Sensor 6 documents a total of seven alerts resulting in just two work orders being created.
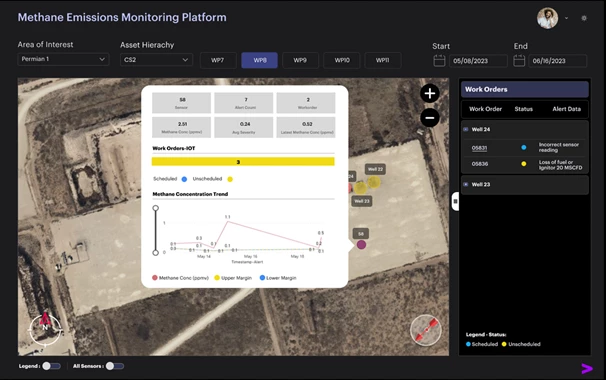
Figure 6: MEMP dashboard visualizing alerts and resulting work orders for Sensor 6.
Emission source attribution and quantification
Once deployed in the field, methane IoT sensors can only measure compound signals in the proximity of their location. For an area of interest that is densely populated with potential emission sources, the challenge is to identify the source(s) of the emission event. Microsoft provides two approaches for identifying the source of a leak:
- Area of influence attribution model: Given the sensor measurements and location, an “area of influence” is computed for a sensor location at which a leak is detected, based on the real-time wind direction and asset geo-location. Then, the asset(s) that lie within the computed “area of influence” are identified as potential emissions sources for that flagged leak.
- Bayesian attribution model: With this approach, source attribution is achieved through inversion of the methane dispersion model. The Bayesian approach comprises two main components—a source leak quantification model and a probabilistic ranking model—and can account for uncertainties in the data stemming from measurement noise, statistical and systematic errors, and provides the most likely sources for a detected leak, the associated confidence level and leak rate magnitude.
Considering the high number of sources, low number of sensors, and the variability of the weather, this poses a complex but highly valuable inverse modeling problem to solve. Figure 7 provides insight regarding leaks and work orders for a particular well (Well 24). Specifically, diagrams provide well-centric and sensor-centric assessments that attribute a leak to this well.
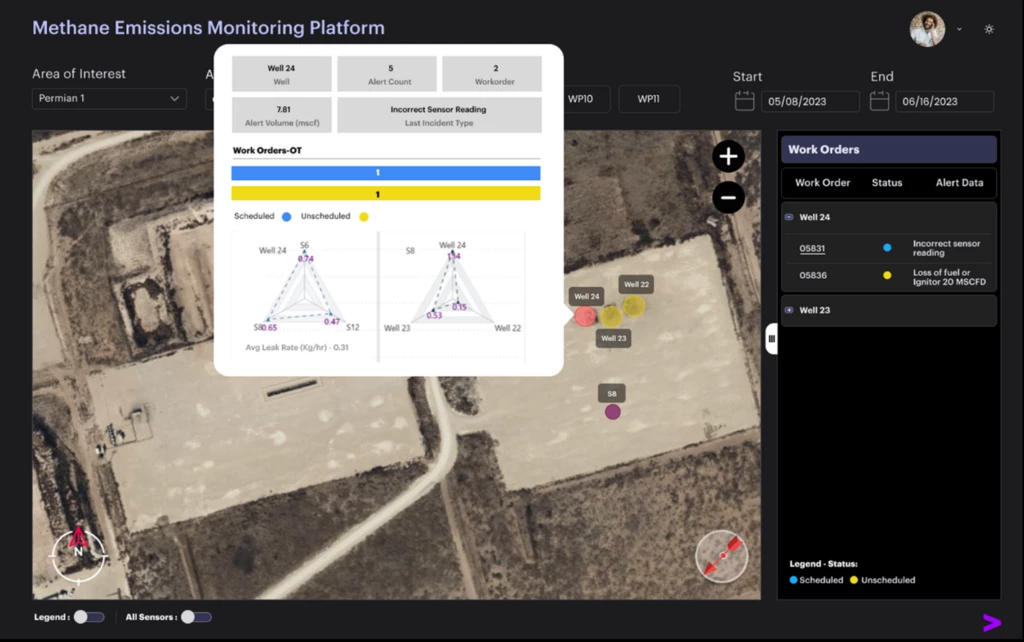
Figure 7: Leak Source Attribution for Well 24.
Further, Accenture’s Work Order Prioritization module using Microsoft Dynamics 365 Field Service application (Figure 8) enables Energy operators to initiate remediation measures under the Leak Detection and Remediation (LDAR) paradigm.
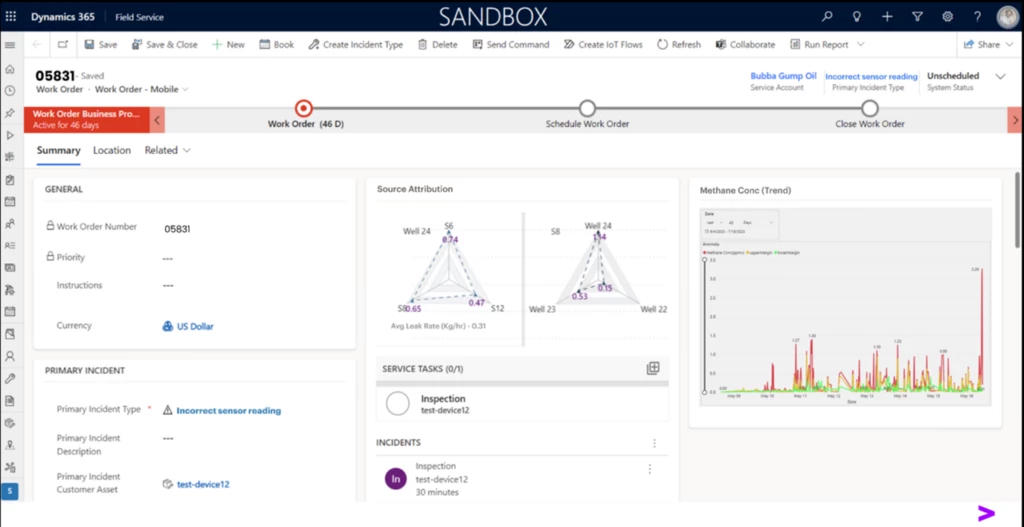
Figure 8: Dynamics 365 Work Order with emission source attribution and CH4 concentration trend data embedded.
Looking ahead
In partnership with Microsoft, Accenture is looking to continue refining MEMP, which is built on the advanced AI and statistical models presented in this blog. Future capabilities of MEMP look to move from “detection and remediation” to “prediction and prevention” of emission events, including enhanced event quantification and source attribution.
Microsoft and Accenture will continue to invest in advanced capabilities with an eye toward both:
- Integrating industry standards platforms such as Azure Data Manager for Energy (ADME) and Open Footprint Forum to enable both publishing and consumption of emissions data.
- Leveraging Generative AI to simplify the user experience.
Learn more
Case study
Duke Energy is working with Accenture and Microsoft on the development of a new technology platform designed to measure actual baseline methane emissions from natural gas distribution systems.
Accenture Methane Emissions Monitoring Platform
More information regarding Accenture’s MEMP can be found in “More than hot air with methane emissions”. Additional information regarding Accenture can be found on the Accenture homepage and on their energy page.
Microsoft Azure Data Manager for Energy
Azure Data Manager for Energy is an enterprise-grade, fully managed, OSDU Data Platform for the energy industry that is efficient, standardized, easy to deploy, and scalable for data management—ingesting, aggregating, storing, searching, and retrieving data. The platform will provide the scale, security, privacy, and compliance expected by our enterprise customers. The platform offers out-of-the-box compatibility with major service company applications, which allows geoscientists to use domain-specific applications on data contained in Azure Data Manager for Energy with ease.
Related publications and conference presentations
Source Attribution and Emissions Quantification for Methane Leak Detection: A Non-Linear Bayesian Regression Approach. Mirco Milletari, Sara Malvar, Yagna Oruganti, Leonardo Nunes, Yazeed Alaudah, Anirudh Badam. The 8th International Online & Onsite Conference on Machine Learning, Optimization, and Data Science.
Surrogate Modeling for Methane Dispersion Simulations Using Fourier Neural Operator. Qie Zhang, Mirco Milletari, Yagna Oruganti, Philipp Witte. Presented at the NeurIPS 2022 Workshop on Tackling Climate Change with Machine Learning.
1NASA Says 2022 Fifth Warmest Year on Record, Warming Trend Continues