In today’s world of modern applications, metrics play a key role in helping you understand how your apps, services, and the infrastructure they run on, are performing. They can help you detect, investigate, and diagnose issues when they crop up. To provide you this level of visibility Azure has made resource-level platform metrics available via Azure Monitor. However, many of you need to collect more metrics, and unlock deeper insights about the resources and applications you are running in your hybrid environment.
To accomplish this, you have already been able to send custom metrics from your apps via Application Insights SDKs. Today, we are happy to announce the public preview of custom metrics in Azure Monitor, now enabling you to submit metrics, collected anywhere, for any Azure resource. These metrics can be additional performance indicators, like Memory Utilization, about your resources; or business-related metrics emitted by your application, like page load times. As part of the unified metric experience in Azure Monitor, now you can:
- Send custom metrics with up to 10 dimensions
- Categorize and segregate metrics using namespaces
- Leverage a unified set of metrics and alerts experiences via Azure Monitor
- Plot custom metrics alongside your resources’ platform metrics in charts and dashboards on the Azure Portal
- Access your custom metrics via the same set of REST APIs as your platform metrics
- Author and configure alert rules on any custom metric emitted to Azure Monitor; with added support to enable you to filter on any dimensions the metric has
- Three months of retention of your custom metrics, preserved at 1-min granularity
You can send your custom metrics to Azure Monitor in a few different ways:
- Send your metrics via our new custom metrics REST API
- Publish metrics from your Windows VMs via the Windows Diagnostics Extension (WAD)
- Publish metrics from your Linux VMs using the InfluxData Telegraf Agent
- Instrument your application using the Application Insights SDK
Read on to learn how you can get started on emitting your custom metrics to Azure Monitor.
Emit metrics from your Windows VMs
Many of you use the Azure Diagnostics Extensions (Windows and Linux) on Azure VMs and Classic Cloud Services to collect detailed guest OS level performance data. Previously, these diagnostics extensions allowed you to send the data to your Storage Tables and supported a limited set of metrics experiences on top of these guest-OS metrics.
As part of today’s release, we have upgraded the Windows Diagnostic Extension to have the option to send your performance counters directly to the Azure Monitor. This means you can chart, alert on, query, and filter on dimensions for Windows guest-OS metrics directly via the Azure Monitor experiences and REST APIs. We have published a walkthrough on how to install and configure the diagnostics extension. Sending guest OS metrics to Azure Monitor using the Linux diagnostics extension is not available at this time but will be coming soon.
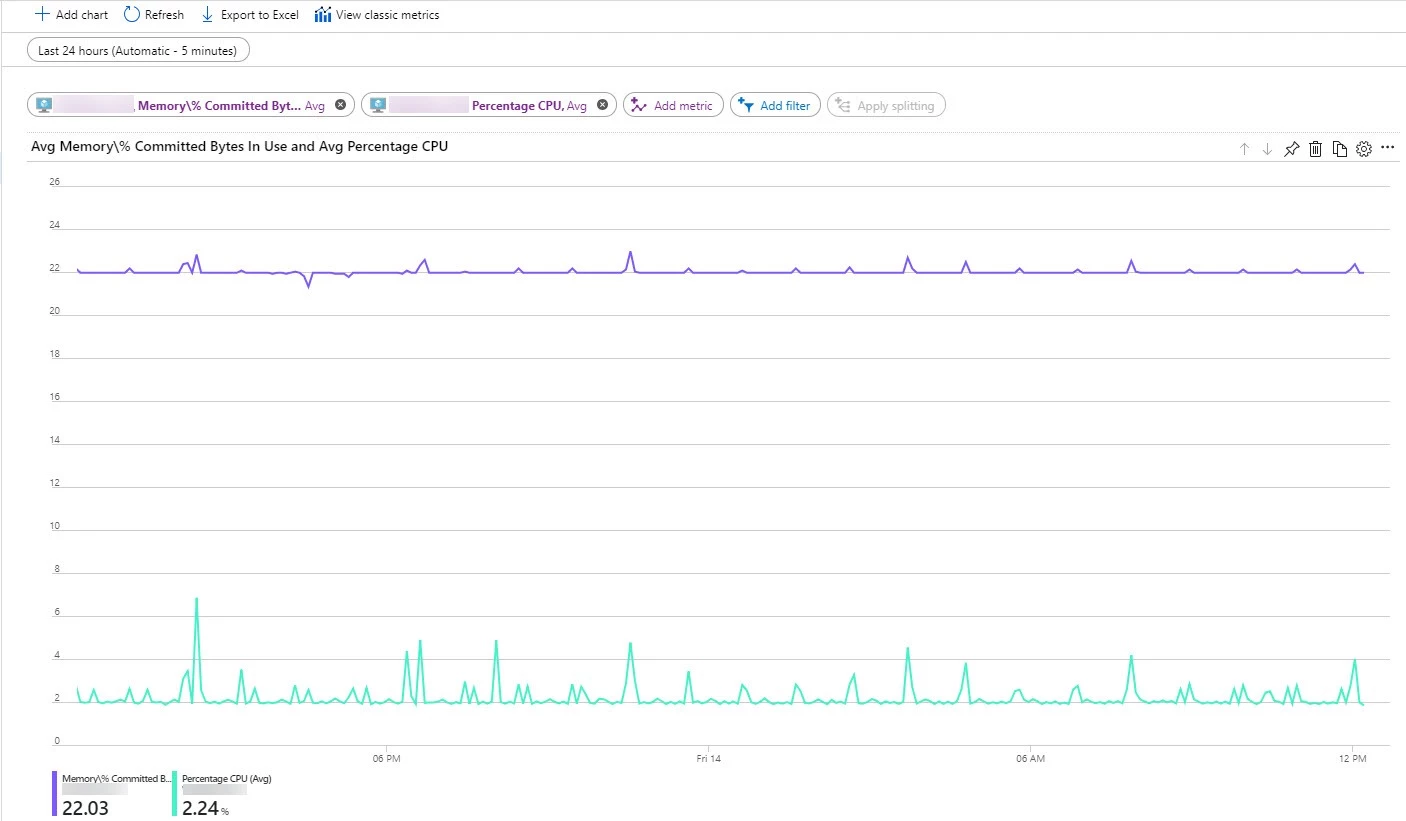
A chart showing a guest OS metric (‘Memory/% Committed Bytes’) and a platform metric (‘Percentage CPU’) plotted side-by-side for a Windows Virtual Machine
Emit metrics from your Linux VMs using InfluxData’s Telegraf plugin agent
There’s a rich ecosystem of open source monitoring tools that enable you to collect metrics for workloads running on Linux VMs. Telegraf, is one such popular open-source agent. That is why we worked with our partners at InfluxData, the team behind this agent, to build an integration with Azure Monitor.
Telegraf is an open-source plugin-driven agent that enables the collection of metrics from over 150 different sources (depending on what’s running on your VM). Most of these plugins are contributed by the community which means you can expect even more collector agents to become available in the coming months. Output plugins, then enable the agent to write to destinations of your choosing. The agent integrated directly with our custom metrics REST API, and now supports a brand new “Azure Monitor Output plugin”. This enables you to install the Telegraf agent and collect metrics about the workloads (ex. MySQL, NGINX etc.) running on your Linux VM and have them published to Azure Monitor as custom metrics. Here is a quick walkthrough on how to set this up yourself!
Unified experience for Application Insights SDK emitted metrics
As part of Application Insights, you’ve always had the ability to use the Application Insights SDK to instrument your code to collect insights about your application and emit these as custom metrics. From there you were able to alert on these metrics and plot charts with the ability to split and filter on dimensions. Today we are enabling you to alert on dimensions as well; this is automatically available for all standard metrics emitted by Application Insights. To enable alerting on dimensions for your custom metrics there is a simple opt-in experience for your Application Insights component.
Pricing
All resource-level platform metrics will continue to be available to you for free. Custom metrics emitted against Azure resources will be metered. Custom metrics will be free for the first 150MB per month, after which they will be subject to metering based on the volume of data ingested.
Application Insights customers will continue to be metered based on the current Application Insights pricing model with no changes. Enabling dimensional alerting on custom metrics is completely optional, opting into this feature will be subject to custom metrics metering.
More information on the pricing of these features can be found here.
Wrapping up
Azure already gives you visibility into how your resources are performing with platform metrics via Azure Monitor. Now, you can supplement these metrics by emitting your own custom metrics about your applications and resources to Azure Monitor. We are excited about this initial release and in the coming months will continue to make this available in more Azure regions, add more features, and enable other capabilities across Azure Monitor to take advantage of custom metrics. We would love to hear from you as you try this out; drop us a comment, or head over to User Voice to let us know what you think!