Customers often ask us about the scalability and throughput limits of the consumption plan for Azure Functions. The short answer is always “it depends, what does your workload look like?”. Today I want to talk about running high scale Event Hub/IOT Hub workloads on Azure Functions and some key points to be aware of in order to maximize the performance you get from the platform.
We partnered with the Azure CAT team to build a simple but representative event processing pipeline using Azure Functions and Event Hubs, with telemetry going into Application Insights:
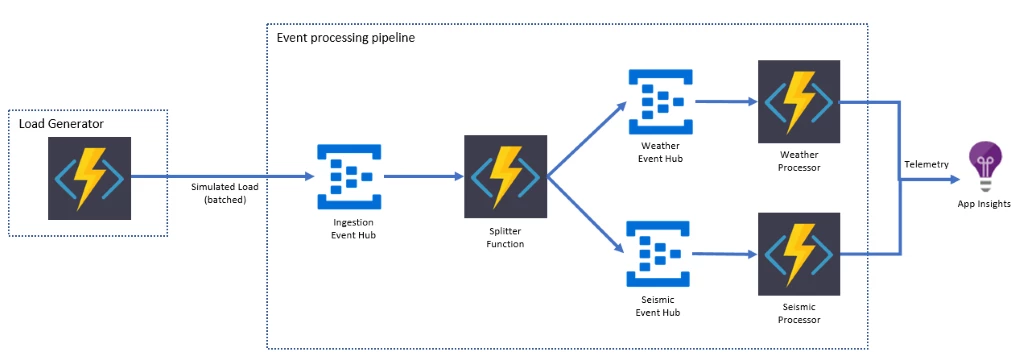
The load generator, also running on Functions, writes batched messages to an ingestion event hub. These messages represent a set of readings from a given sensor. Functions picks up messages from the ingestion event hub, extracts individual readings from the batch, and writes them to the target event hub augmenting the messages with additional telemetry along the way. Two more functions within the same function app on the consumption plan each process the individual readings and send aggregated telemetry to App Insights.
Performance
We ran the system under a target load of 100,000 events per second for a total of nine days. Over that time the system processed a total of 76 billion events. We measured the e2e latency of the pipeline, for example, the amount of time taken between writing the message to the ingestion hub and processing the message in the weather/seismic function. Here are the results:
E2E Latency Percentiles
| P50 | P90 | P95 | P99 | P99.9 | P99.99 | Max |
| 1,102.42ms | 2,755.56ms | 3,788.30ms | 11,894.12ms | 50,367.23ms | 111,240.50ms | 239,890.10ms |
In simple terms:
- Half of the messages were processed within 1.2 seconds of being written to the ingestion hub
- Nine out of ten messages were processed in under three seconds
- 999 out of 1000 messages were processed in under one minute
- All messages were processed in under five minutes
Monitoring
Azure Functions has two built in monitoring solutions, the WebJobs dashboard and Application Insights. Integration between Azure Functions and App Insights is currently in preview. The dashboard was designed with longer running jobs in mind and isn’t optimized for scenarios where there are 10,000 plus function executions happening per second. Fortunately, App Insights is an incredibly robust telemetry system and we’ve made sure that it works great with Azure Functions in high scale scenarios.
Turning on App insights is really easy, just add your instrumentation key to your function app and Azure Functions will start sending data to App Insights automatically. For more info read the blog, “Azure Functions now has direct integration with Application Insights.”
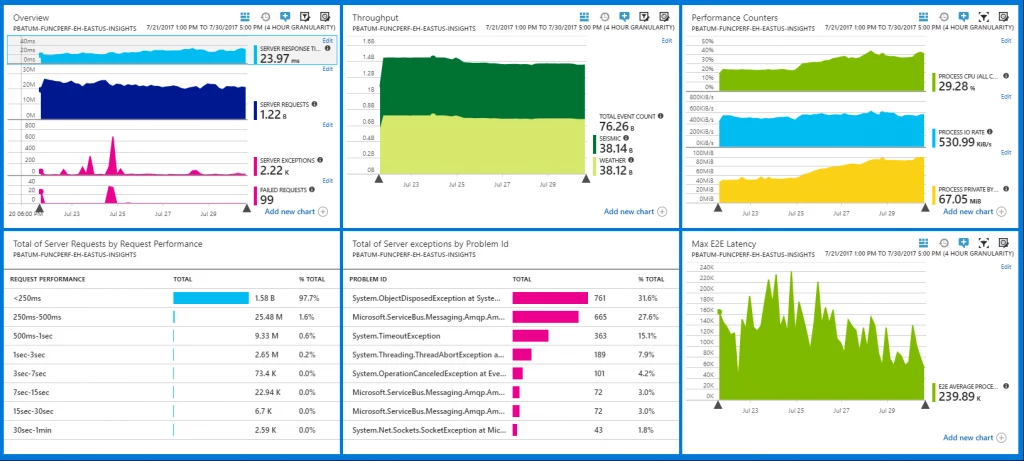
The Azure dashboard is highly customizable and App Insights has great support for pinning its visual components. It only took an hour or two to put together a pretty useful monitoring dashboard for this scenario:
Configuration
We made some notable configuration choices to achieve this result:
- The functions process messages in batches
- The WebJobs dashboard is disabled in favor of using Application Insights for monitoring and telemetry
- Each event hub is configured with 100 partitions
- Data is sent to the event hubs without partition keys
- Events are serialized using protocol buffers
See below for additional details on each of these.
Batching
An event hub triggered function can be written to process single messages or batches of messages. The latter has much better performance characteristics. Lets take the splitter function as an example:
public static async Task Run(

EventData[] sensorEvent,

PartitionContext partitionContext,

IAsyncCollector outputWeatherData,

IAsyncCollector outputSeismicData,

TraceWriter log)

		{

   foreach (var sensorData in sensorEvent)

				{

SensorType sensorType = SensorType.Unknown;

   try

						{

   if (sensorData.Properties.ContainsKey("SensorType"))

								{

System.Enum.TryParse(sensorData.Properties["SensorType"].ToString(), out sensorType);

								}

								await ProcessEvent(sensorData, sensorType, partitionContext, outputWeatherData, outputSeismicData);

						}

catch(Exception ex)

						{

telemetryHelper.PostException(ex, sensorData, partitionContext.Lease.PartitionId, sensorType.ToString());

						}

				}

		}
The main things to note about this code:
- An array of events are passed to the function in one execution
- An exception handling block wraps the processing of each event
The array based approach performs better primarily due to per function execution overhead. The system performs a number of actions when invoking your function and those actions will only happen once for an array of events rather than once per event. Please note, for JavaScript functions you’ll need to explicitly set the cardinality property in your function.json to many in order to enable batching. You an find examples of enabling batching on GitHub.
This approach to exception handling is important if you want to ensure you don’t lose or skip messages. Typically you’ll write your exception handler so that it stores the event that failed for later processing and analysis. This is important because Azure Functions does not have any built in dead lettering for Event Hubs.
WebJobs dashboard
As mentioned above, because we were using App Insights for monitoring we disabled the dashboard. To do this simply go to your application setting and remove the AzureWebJobsDashboard setting.
Partition configuration
Azure Functions uses the EventProcessorHost provided in the Event Hubs SDK to process event hub messages. For more information see our documentation, “Programming guide for Azure Event Hubs.” The way EventProcessorHost works is that each VM running your app acquires leases to some of the partitions, allowing it to process messages on those partitions. This means that if your event hub has only two partitions, only two VMs can process messages at any given time i.e. the partition count puts an upper limit on the scalability of your function.
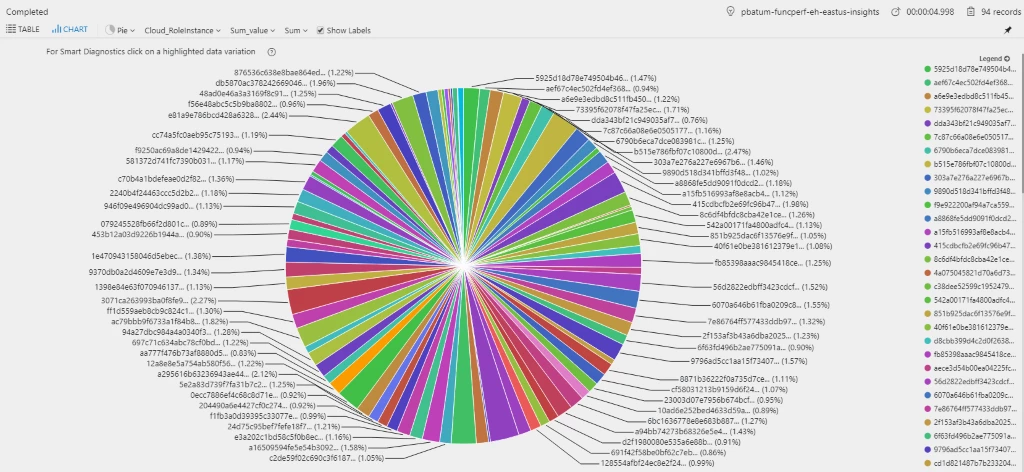
The basic and standard tiers for Event Hubs have a default limit of 32 partitions per event hub, but this limit can be increased if you contact billing support. By setting the event hubs to have 100 partitions, each function was able to run on 100 VMs simultaneously. We can see this if we look at one minute of telemetry, counting the number of unique VMs that executed the weather function:
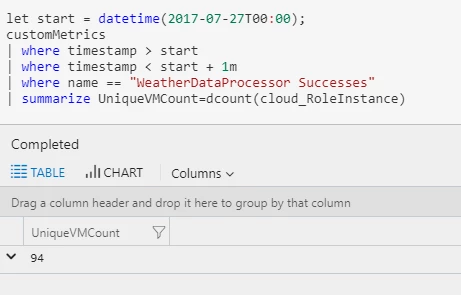
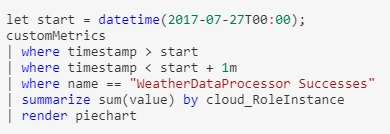
We can get an idea of how evenly the work was distributed over those 94 VMs with another simple query:
Partition keys
The event hubs programming guide has a good summary of partition keys and when you might want to use them. This scenario had no ordering or statefulness requirements so events were generated without partition keys. This increased the overall throughput and availability for the run.
Protocol buffers
If you’re writing and reading 100,000+ events a second, you want the serialization and deserialization of those events to be as efficient as possible, both from the perspective of time taken to do the serialization step and also size on the wire. Protocol buffers is a high performance serialization format that is easy to work with. Here’s some example code deserializing and processing a batch of weather readings from an event:
if (sensorType == SensorType.Weather)

{

  var batch = WeatherReadingBatch.Parser.ParseFrom(sensorData.GetBytes());

  var messages = batch.SensorReadings

.Select(reading => EnrichData(enqueuedTime, reading));

  await WriteOutput(messages, sensorData.PartitionKey, outputWeatherData);

}
If you’d like to see the .proto file used for this scenario see the Protocol Buffers example in GitHub.
Cost
The total cost of running the function app and its dependencies for the nine day run was approximately $1200 USD. Here’s what the cost per hour looks like for each service:
| Service | Cost per Hour (USD) |
| Functions | $2.71 |
| Storage | $1.80 |
| Application Insights | $1.03 |
A few important points to note:
- This data does not include the cost of the load generator and Event Hubs as no effort was spent on optimizing these.
- The Azure Storage cost is based on approximately 50 million transactions per hour. Almost all of these transactions are related to Event Hubs checkpointing.
- The Application Insights cost is based on 450mb of data ingestion per hour.
We can dive into function app cost in more detail by using the execution count and execution units data available via the Azure Monitor REST API. For more information please visit the Stack Overflow forum. Querying for one hour of data, we get the following:
- Function Execution Count: 6,500,012
- Function Execution Units: 90,305,037,184
Note, the function execution units here are measured in mb-milliseconds. To convert these into gb-seconds, divide by 1024000. You can find pricing details for functions and a simple program I wrote in order to assist:
Cost per hour = (6,500,012 executions * ( $0.20 / 1,000,000 )) + ((90,305,037,184 units / (1024 * 1000)) * $0.000016) = $2.71 USD
Summary
The consumption plan for Azure Functions is capable of scaling your app to run on hundreds of VMs, enabling high performance scenarios without having to reserve and pay for huge amounts of compute capacity up front. To learn more about Azure Functions and building cloud applications on serverless technology, start on the Functions product page.
