Monitoring on Azure HDInsight Part 1: An Overview
Posted on
4 min read
Azure HDInsight offers several ways to monitor your Hadoop, Spark, or Kafka clusters. Monitoring on HDInsight can be broken down into three main categories:
- Cluster health and availability
- Resource utilization and performance
- Job status and logs
Two main monitoring tools are offered on Azure HDInsight, Apache Ambari, which is included with all HDInsight clusters, and optional integration with Azure Monitor logs, which can be enabled on all HDInsight clusters. While these tools contain some of the same information, each has its advantages in certain scenarios. Read on for an overview of the best way to monitor various aspects of your HDInsight clusters using these tools.
Cluster health and availability
Azure HDInsight is a high-availability service that has redundant gateway nodes, head nodes, and ZooKeeper nodes to keep your HDInsight clusters running smoothly. While this ensures that a single failure will not affect the functionality of a cluster, you may still want to monitor cluster health so you are alerted when an issue does arise. Monitoring cluster health refers to monitoring whether all nodes in your cluster and the components that run on them are available and functioning correctly.
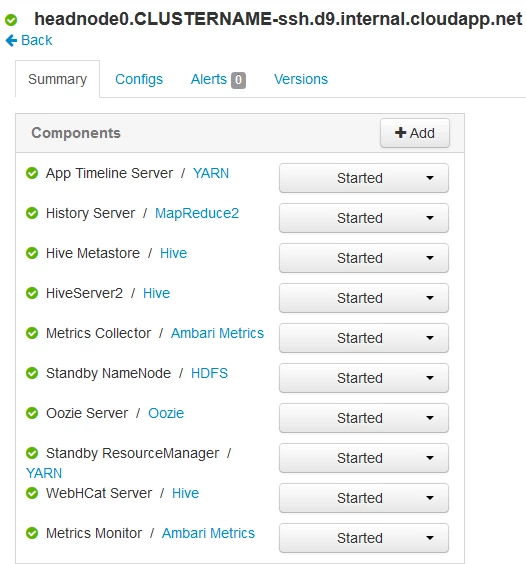
Ambari is the recommended tool for monitoring the health for any given HDInsight cluster. You can learn more about monitoring cluster availability using Ambari in our documentation, “Availability and reliability of Apache Hadoop clusters in HDInsight.”

Ambari portal view showing the status of all components on a head node
Cluster resource utilization and performance
To maintain optimal performance on your cluster, it is essential to monitor resource utilization. This can be accomplished using Ambari and Azure Monitor logs.
With Ambari
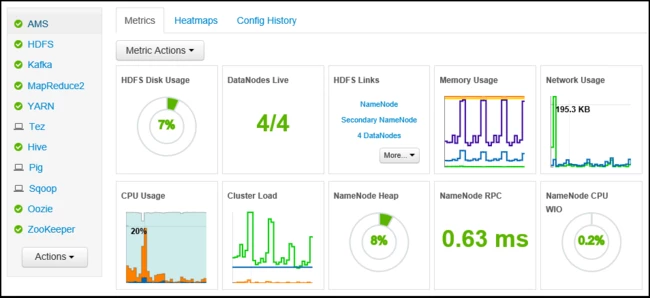
Ambari is the recommended tool for monitoring utilization across the whole cluster. The Ambari dashboard shows easily glanceable widgets that display metrics such as CPU, network, YARN memory, and HDFS disk usage. The specific metrics shown depend on cluster type. The “Hosts” tab shows metrics for individual nodes so you can ensure the load on your cluster is evenly distributed.
The “YARN Queue Manager” is also accessible through Ambari. This allows you to manage the capacity of each of your job queues to see how jobs are distributed between them and whether any jobs are resource constrained. Read more about using Ambari to monitor cluster performance in our documentation, “Monitor cluster performance.”

The Ambari portal dashboard that shows the utilization of your entire cluster at a glance
With Azure Monitor logs
You can monitor resource utilization at the virtual machine (VM) level using Azure Monitor logs. All VMs in an HDInsight cluster push performance counters into the Perf table in your Log Analytics workspace, including CPU, memory, and disk usage. Like any other Log Analytics table, you can query the Perf table, create visualizations with view designer, and configure alerts. One of the key benefits of Azure Monitor logs is that you can push metrics and logs from multiple HDInsight clusters to the same Log Analytics workspace, allowing you to monitor multiple clusters in one place. You can read more about working with performance data in Azure Monitor logs by visiting our documentation, “View or analyze data collected with Log Analytics log search.”
Workload information and logs
Another key part of monitoring HDInsight clusters is monitoring the information about the workloads running on your clusters and viewing relevant logs to assist with debugging. For example, you may want to monitor incoming data on Kafka or know when a Spark job fails.
With Azure Monitor logs
The recommended way to monitor workload information and logs on Azure HDInsight is using Azure Monitor logs. HDInsight clusters can emit workload-specific metrics and logs from the OSS components to a Log Analytics workspace. For example, Spark/Hadoop clusters can emit the number of submitted, pending, failed, and killed apps, and Kafka clusters can emit the number of and incoming messages and incoming/outgoing bytes. You can query the tables in your Log Analytics workspace and set up Azure Monitor alerts that will fire when certain metrics meet your defined thresholds. For example, you could set up an alert that fires and sends you an email or takes some other action whenever a Spark job fails.
Azure HDInsight monitoring solutions
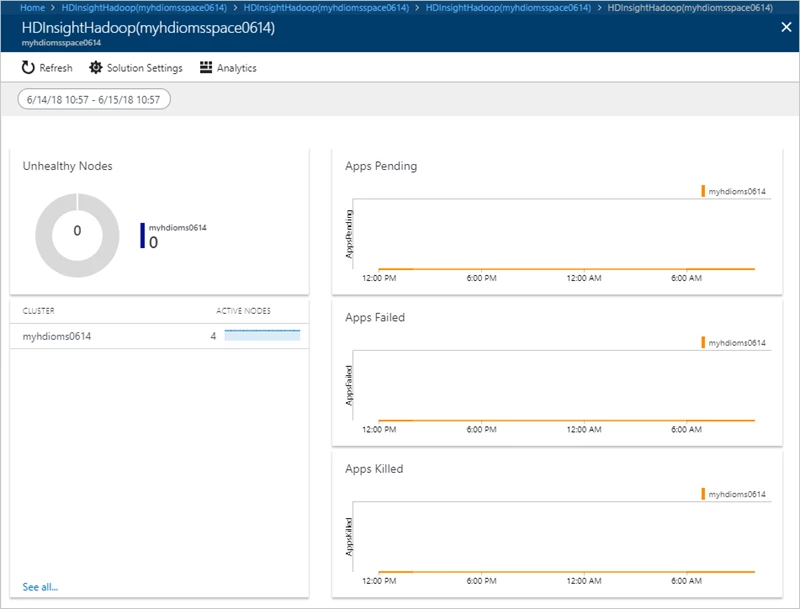
Workload-specific Azure HDInsight monitoring solutions that build on top of the Azure Monitor logs integration are also available. These solutions come in the form of premade dashboards that contain visualizations for the aforementioned workload-specific metrics. For example, the Spark solution shows graphs of metrics like pending, failed, and killed apps over time. Because these solutions are backed by a Log Analytics workspace, the visualizations show data for all clusters that emit metrics to the workspace. As a result, you can see visualizations of these workload metrics from multiple clusters of the same type all in one place.

The HDInsight Spark monitoring solution
With Ambari
You can also view workload information from Spark/Hadoop clusters in the YARN ResourceManager UI, which is accessible via the Ambari portal. The YARN UI shows detailed information about all job submissions and their statuses, and the Ambari portal provides links to the ResourceManager log files if you need to further debug jobs.
On the cluster
To access log files directly on the cluster, see our documentation, “Manage logs for an HDInsight cluster.”
Try HDInsight now
Between Apache Ambari and Azure Log Analytics integration, HDInsight offers comprehensive tools for monitoring all aspects of your HDInsight cluster. We hope you will take full advantage of monitoring on HDInsight and we are excited to see what you will build with Azure HDInsight. Read this developer guide and follow the quick start guide to learn more about implementing these pipelines and architectures on Azure HDInsight. Stay up-to-date on the latest Azure HDInsight news and features by following us on Twitter #AzureHDInsight and @AzureHDInsight. For questions and feedback, reach out to AskHDInsight@microsoft.com.
About HDInsight
Azure HDInsight is an easy, cost-effective, enterprise-grade service for open source analytics that enables customers to easily run popular open source frameworks including Apache Hadoop, Spark, Kafka, and others. The service is available in 36 public regions and Azure Government and National Clouds. Azure HDInsight powers mission-critical applications in a wide variety of sectors and enables a wide range of use cases including ETL, streaming, and interactive querying.