Best practices, Developer Tools, Visual Studio
Live Metrics Stream in Application Insights
Posted on
1 min read
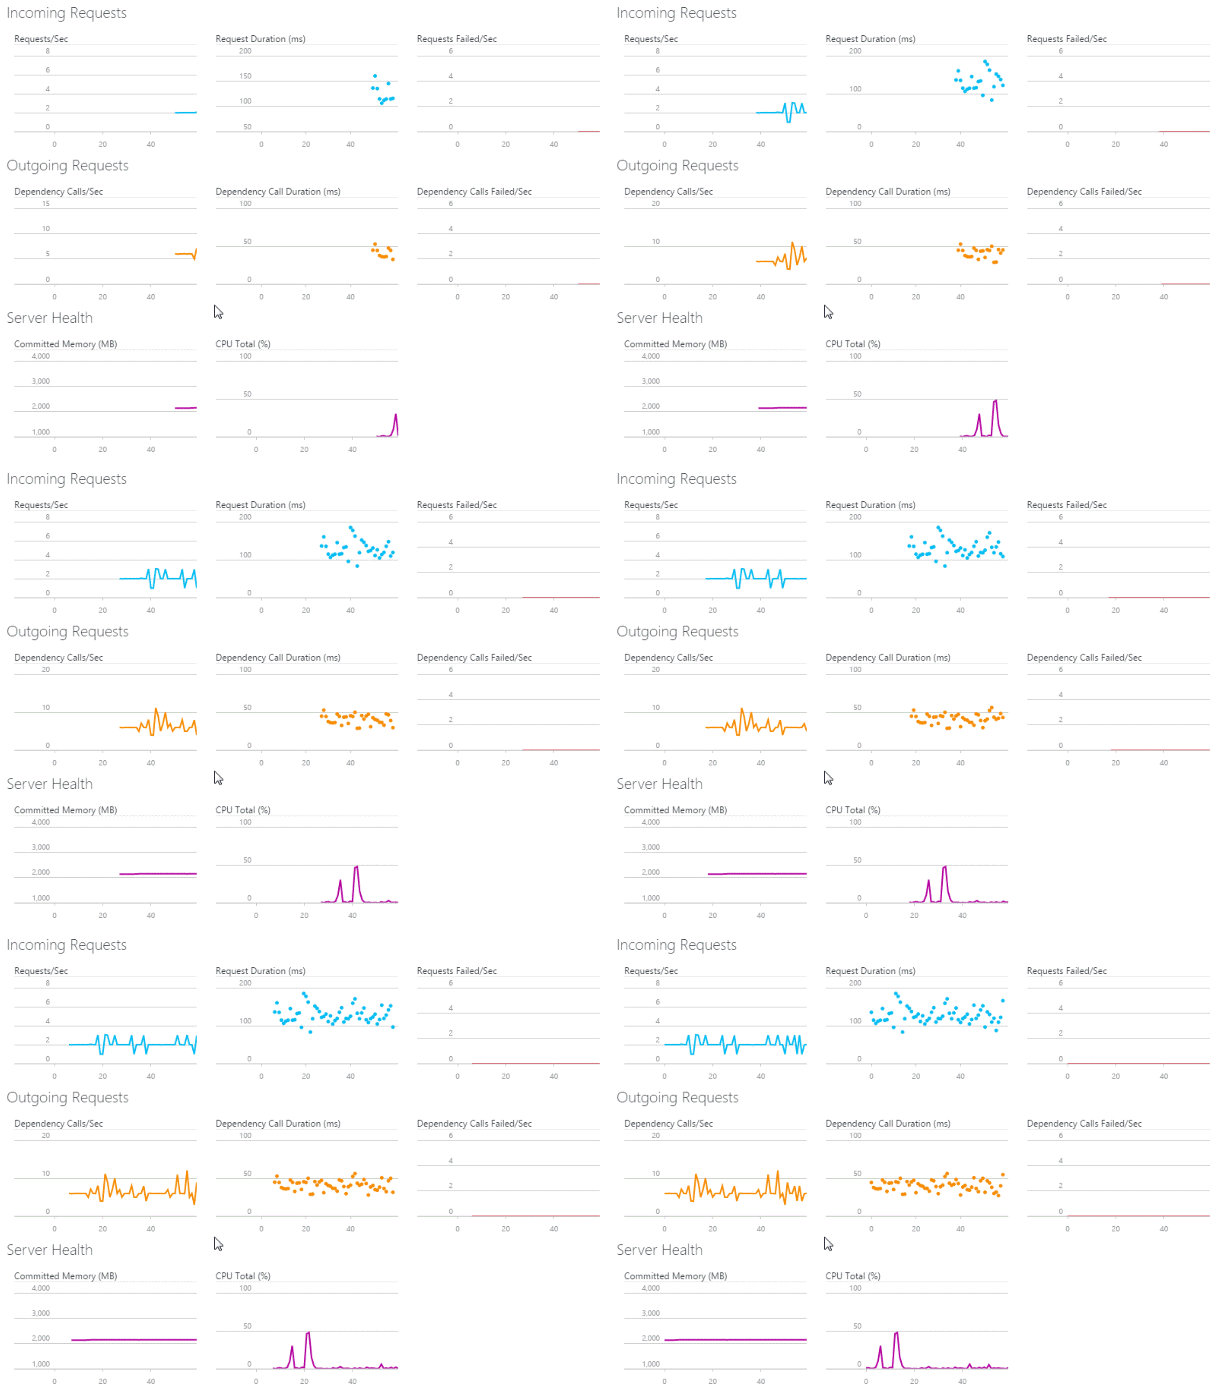
When you deploy a new version of your web app, you want to know immediately its effect on performance. Have response times improved or worsened, or is it showing failures? Watch Live Metrics Stream in Application Insights while your deployment is happening, and you’ll see the effect immediately. If there are problems, you could back out the deployment before too many users are affected.
Another scenario is when you’re expecting a huge influx of users, perhaps following a broadcast.
By contrast with the pipeline that feeds Metrics Explorer, Live Metrics is designed to have minimal latency. But it doesn’t store data or provide search facilities.

Looking over these charts gives you a quick idea for how your application is currently performing. Be aware of when your users are experiencing failures and see how the rest of your application is performing at the same time.
Demo
See Live Metrics Stream demoed here.
Experience
Live Metrics Stream is available today out of the box without any additional configuration. This feature is now available in the SDK for .NET web applications 2.1.0-beta2 or later.
Please let us know…
For any issues or feature requests please visit the Application Insights for .NET Web Applications repository.
The Application Insights team is committed to providing quality tools for developers. We would greatly appreciate any feedback or new feature recommendations.