Analytics, Azure Security Center, How to, Log Analytics, Security
Detect malicious activity using Azure Security Center and Azure Log Analytics
Posted on
7 min read
This blog post was authored by Microsoft Threat Intelligence Center.
We have heard from our customers that investigating malicious activity on their systems can be tedious and knowing where to start is challenging. Azure Security Center makes it simple for you to respond to detected threats. It uses built-in behavioral analytics and machine learning to detect threats and generates alerts for the attempted or successful attacks. As discussed in a previous post, you can explore the alerts of detected threats through the Investigation Path, which uses Azure Log Analytics to show the relationship between all the entities involved in the attack. Today, we are going to explain to you how Security Center’s ability to detect threats using machine learning and Azure Log Analytics can help you keep pace with rapidly evolving cyberattacks.
Investigate anomalies on your systems using Azure Log Analytics
One method is to look at the trends of processes, accounts, and computers to understand when anomalous or rare processes and accounts are run on computers which indicates potentially malicious or unwanted activity. Run the below query against your data and note that what comes up is an anomaly or rare over the last 30 days. This query shows the processes run by computers and account groups over a week to see what is new and compare it to the behavior over the last 30 days. This technique can be applied to any of the logs provided in the Advanced Azure Log Analytics pane. In this example, I am using the Security Event table.
Please note the items in bold are an example of filtering your own results for noise and is not specifically required. The reason I have included it is to make it clear there will be certain items that are not run often and show up as anomalous when using this or similar queries, which are specific to your environment and may need manual exclusion to help focus the investigation. Please build your own list of “known good” items to filter out based on your environment.
let T = SecurityEvent
| where TimeGenerated >= ago(30d)
| extend Date = startofday(TimeGenerated)
| extend Process = ProcessName
| where Process != ""
| where Process != "-"
| where Process !contains "WindowsSystem"
| where Process !contains "Program FilesMicrosoft"
| where Process !contains "Program FilesMicrosoft Monitoring Agent"
| where Process !contains "ProgramData"
| where Process !contains "WindowsWinSxS"
| where Process !contains "WindowsSoftwareDistribution"
| where Process !contains "mpsigstub.exe"
| where Process !contains "WindowsAzureGuestAgent"
| where Process !contains "WindowsServicingTrustedInstaller.exe"
| where Process !contains "WindowsMicrosoft.Net"
| where Process !contains "PackagesPlugins"
| project Date, Process, Computer, Account
| summarize count() by Date, Process, Computer, Account
| sort by count_ desc nulls last;
T
| evaluate activity_counts_metrics(Process, Date, startofday(ago(30d)), startofday(now()), 1d, Process, Computer, Account)
| extend WeekDate = startofweek(Date)
| project WeekDate, Date, Process, PotentialAnomalyCount = new_dcount, Account, Computer
| join kind= inner
(
    T
    | evaluate activity_engagement(Process, Date, startofday(ago(30d)), startofday(now()),1d, 7d)
    | extend WeekDate = startofweek(Date)
    | project WeekDate, Date, Distribution1day = dcount_activities_inner, Distribution7days = dcount_activities_outer, Ratio = activity_ratio*100
)
on WeekDate, Date
| where PotentialAnomalyCount == 1 and Ratio < 100
| project WeekDate, Date, Process, Account, Computer , PotentialAnomalyCount, Distribution1day, Distribution7days, Ratio
| render barchart kind=stacked
When the above query is run, you will receive a TABLE similar to the item below, although the dates and referenced processes will be different. In this example, we can see when a specific process, computer and account had not been seen before based on week over week data for the last 30 days. Specifically, we can see regedit.exe showed up in the week of 4/15 and on the specific date of 4/17, then PowerShell on 4/30 and then Procmon on 4/30 and 5/8 for the first times each week during the last 30 days.
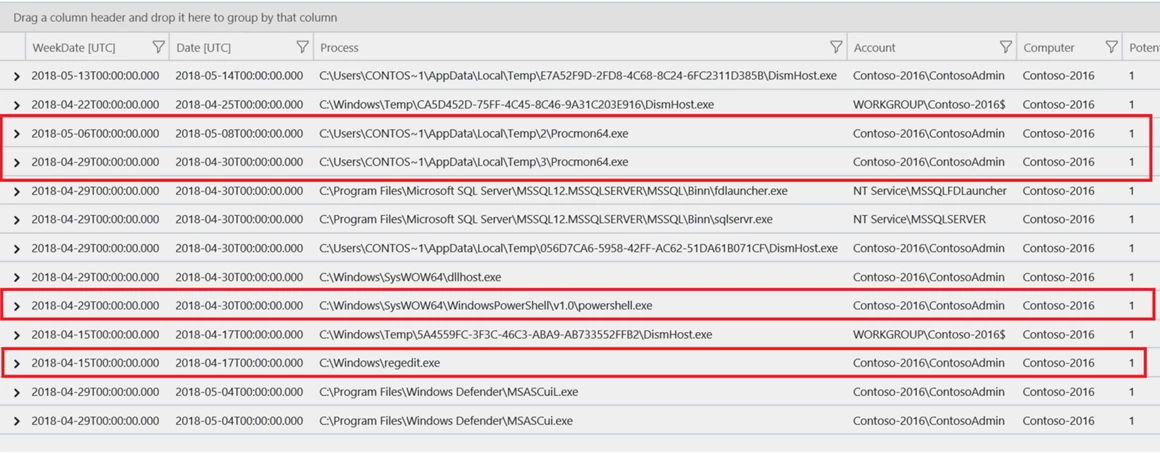
You can also view the results in CHART mode and change the pivot of the bar CHART as seen below. For example, use the drop down and pivot on Computer instead of process and see the computers that launched this process.

Hover to see the specific computer and how many processes showed up for the first time.
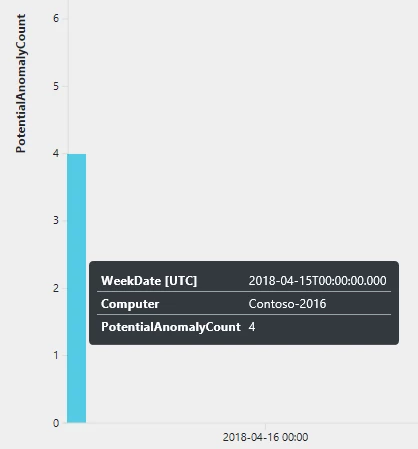
In the query above, we look at the items that run across more than one day, which is the ratio of less than 100. This is a way to parse the date and more easily understand the scope of when a process runs on a given computer. By looking at rare items that have run across multiple days, you can potentially detect manual activity by an attacker who is probing your environment for information that will further increase his attack surface.
We can alternatively look at the processes that ran only on 1 day of the last 30 days, which can be done by choosing only ratio == 100 in the above query, simply change the related line to this:
| where PotentialAnomalyCount == 1 and Ratio == 100
The above change to the query results in a different set of hits for rare processes and may indicate usage of a scripted attack to rapidly gather data from this system, several systems, or may just indicate attacker activity on a single day.
Lastly, we see several interactive processes run, which indicate an interactive logon, for example SQL Mgmt Studio process Ssms.exe. Potentially, this is an unexpected logon to this system and this query can help expose this type of anomaly in addition to unexpected processes.

Once you have identified a computer or account you want to investigate, you can then dig in further on the full data for that computer. This can be done by opening a secondary query window and filtering only on the computer or account that you are interested in. Examples of this would be as follows. At that point, you can see what occurred around the anomalous or rare process execution time. We will select the portping.exe process and narrow the scope of the dates to allow for a closer look. From the table above, we can see the Date[UTC] circled below. This date is rounded to the nearest day for the query to work properly, but this along with the computer and account used should allow us to focus in on the timeframe of when this was run on the computer.

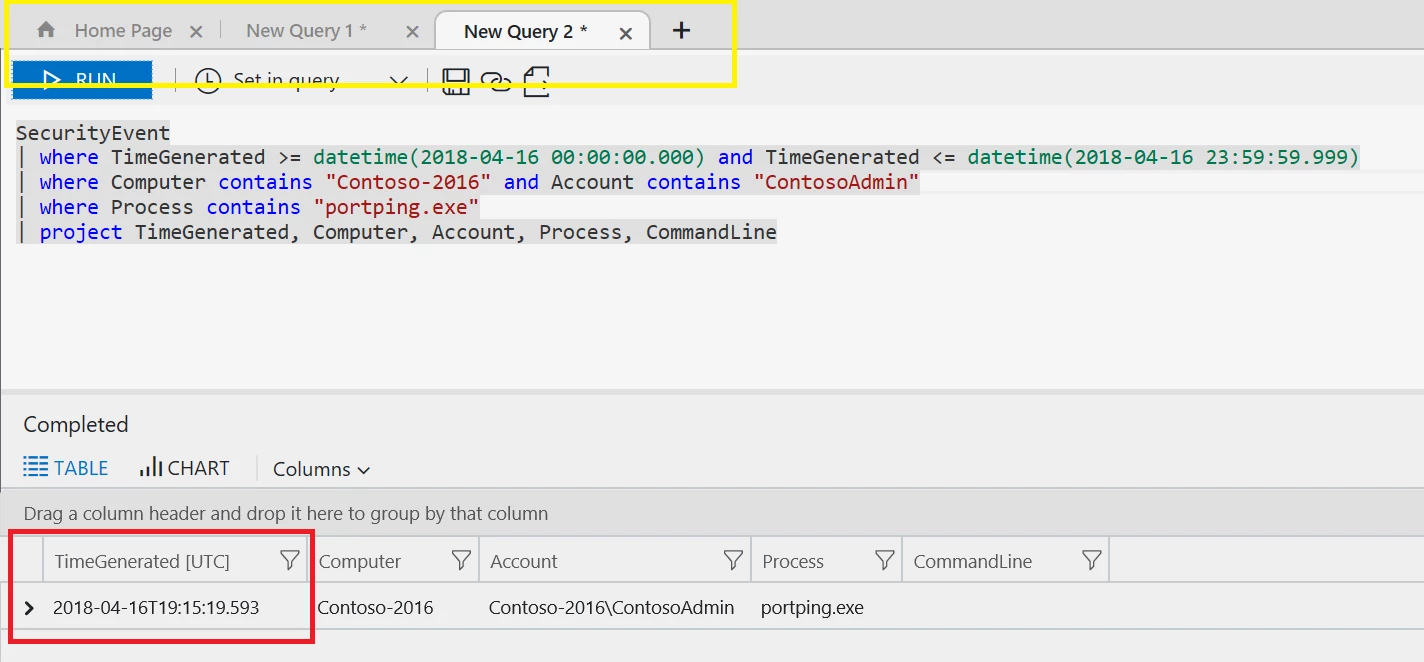
To focus in on the timeframe, we will use that date to provide our single day range. We can pass the range into the query by using standard date formats indicated below. Click on the + highlighted in yellow and paste the below query into your window.
In the results, the distinct time is marked in red. We will use that in a subsequent query.
SecurityEvent
| where TimeGenerated >= datetime(2018-04-16 00:00:00.000) and TimeGenerated <= datetime(2018-04-16 23:59:59.999)
| where Computer contains "Contoso-2016" and Account contains "ContosoAdmin"
| where Process contains "portping.exe"
| project TimeGenerated, Computer, Account, Process, CommandLine
Now that we have the exact time, we can look at activity occurring with smaller time frames around that date. We usually use +5 minute and -5 minute blocks. For example:
SecurityEvent
| where TimeGenerated >= datetime(2018-04-16 19:10:00.000) and TimeGenerated <= datetime(2018-04-16 19:21:00.000)
| where Computer contains "Contoso-2016" and Account contains "ContosoAdmin"
//| where Process contains "portping.exe"
| project TimeGenerated, Computer, Account, Process, CommandLine
In the results below, we can easily see that someone was logged into the system via RDP. We know this because RDPClip.exe is being launched, which indicated they were copying and pasting between their host and the remote system.
Additionally, we see after the portping.exe activity that they are attempting to modify accounts or password functionality with the command netplwiz.exe or control userpasswords2.
They are then running Procmon.exe to see what other processes are running on the system. Generally this is done to understand what is available to the attacker to further exploit.
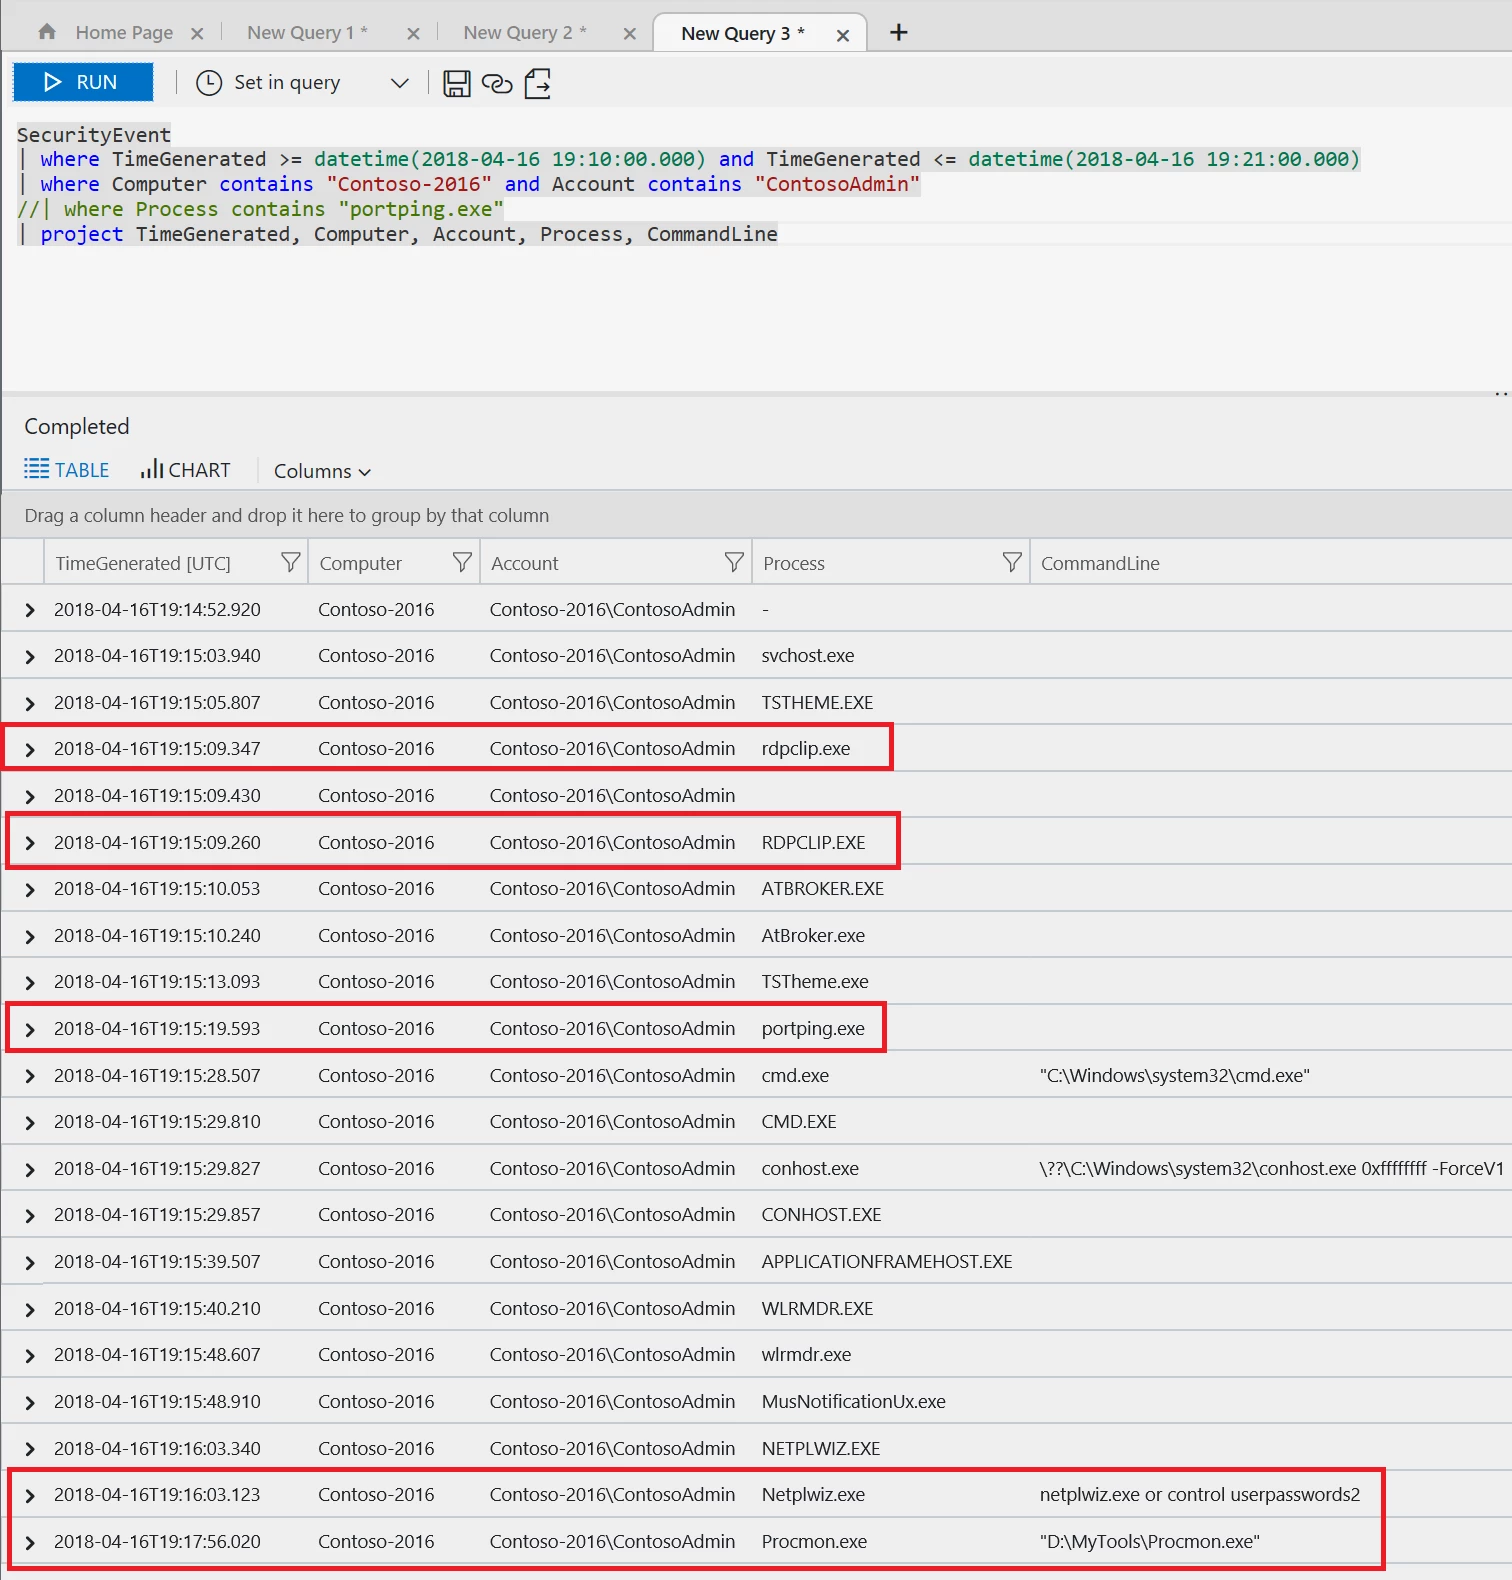
At this point, this machine should be taken offline and investigated more deeply to understand the extent of the compromise.
Find hidden techniques commonly deployed by attackers using Azure Log Analytics
Most security experts have seen the techniques attackers use to hide the usage of commands on a system to avoid detection. While there are certainly methods to avoid even showing up on the command line, the obfuscation technique used below is regularly used by various levels of attackers.
Below we will decode a base64 encoded string in the command line data and look for common PowerShell methods that are used in attacks.
SecurityEvent
| where TimeGenerated >= ago(30d)
| where Process contains "powershell.exe" and CommandLine contains " -enc"
|extend b64 = extract("[A-Za-z0-9|+|=|/]{30,}", 0,CommandLine)
|extend utf8_decode=base64_decodestring(b64)
|extend decode =  replace ("x00","", utf8_decode)
|where decode contains 'Gzip' or decode contains 'IEX' or decode contains 'Invoke' or decode contains '.MemoryStream'
| summarize by Computer, Account, decode, CommandLine

As you can see, the results provide you with details about what was in the encoded command line and potentially what an attacker was attempting to do.
You can now use the details in the above query to see what was running during the same time by adding the time and computer to the same table. This allows you to easily connect it with other activity on the system, the process by which is described just above in detail. One thing to note is that you can add these automatically by expanding the event with the arrow in the first column of the row. Then hover over TimeGenerated and click the + button.

This will add in an entry like so into your query window:
| where TimeGenerated == todatetime('2018-04-24T02:00:00Z')
Modify the range of time like this:
SecurityEvent
| where TimeGenerated >= ago(30d)
| where Computer == "XXXXXXX"
| where TimeGenerated >= todatetime('2018-04-24T02:00:00Z')-5m and TimeGenerated <= todatetime('2018-04-24T02:00:00Z')+5m
| project TimeGenerated, Account, Computer, Process, CommandLine, ParentProcessName
| sort by TimeGenerated asc nulls last
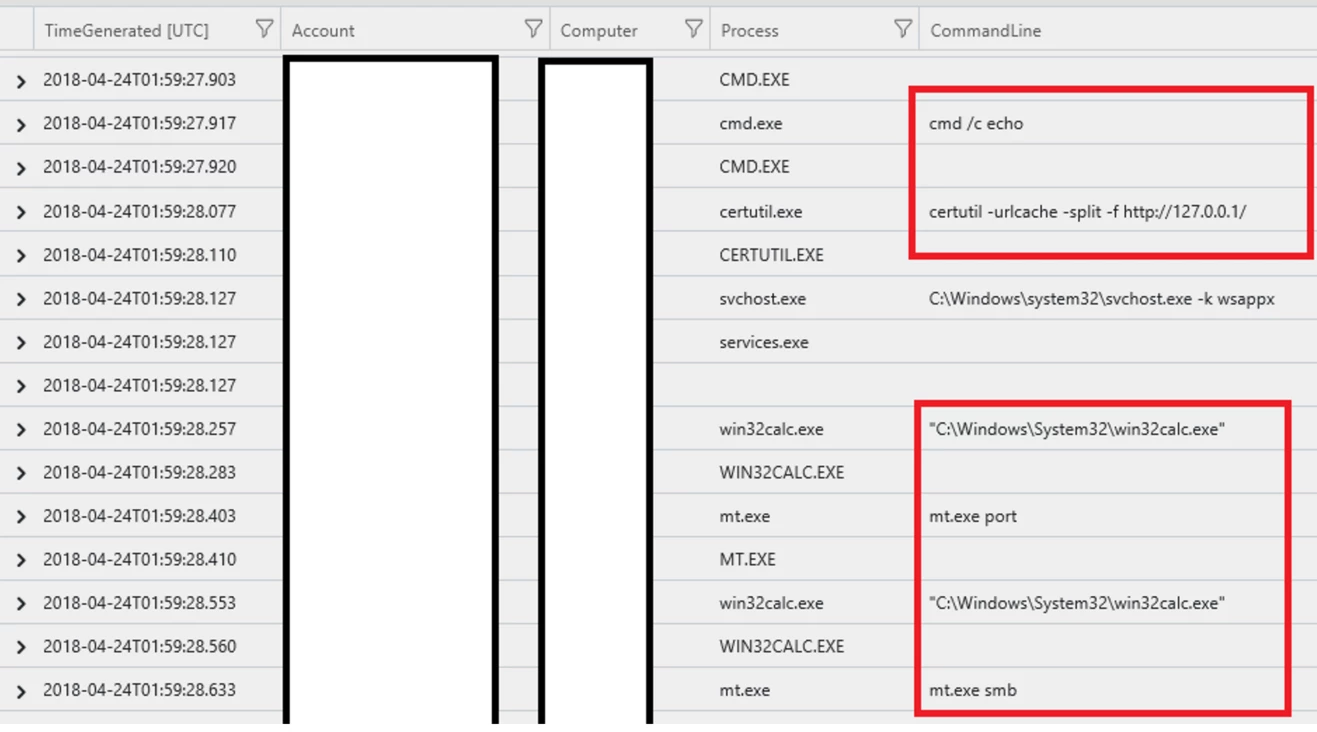
Lastly, connect this to your various alerts using the join to alerts from the last 30 days to see what alerts are associated:
SecurityEvent
| where TimeGenerated >= ago(30d)
| where Process contains "powershell.exe"  and CommandLine contains " -enc"
| extend b64 = extract( "[A-Za-z0-9|+|=|/]{30,}", 0,CommandLine)
| extend utf8_decode=base64_decodestring(b64)
| extend decode =  replace ("x00","", utf8_decode)
| where decode contains 'Gzip' or decode contains'IEX' or decode contains 'Invoke' or decode contains '.MemoryStream'
| summarize by TimeGenerated, Computer=toupper(Computer), Account, decode, CommandLine
| join kind= inner (
      SecurityAlert | where TimeGenerated >= ago(30d)
      | extend ExtProps = parsejson(ExtendedProperties)
      | extend Computer = toupper(tostring(ExtProps["Machine Name"]))
      | project Computer, AlertName, Description
) on Computer

Security Center uses Azure Log Analytics to help you detect anomalies in your data as well as expose common hiding techniques used by attackers. By exploring more of your data through directed queries like these presented above, you may find anomalies that are both malicious and benign, but in doing so you will have made your environment more secure and have a better understanding of the activity that is going on systems and resources in your subscription.
Learn more about Azure Security Center
To learn more about Azure Security Center’s detection capabilities, visit our threat detection documentation.
To learn more about Azure Advance Threat Protection, visit our threat protection documentation.
To learn more about integration with Windows Defender Advanced Threat Protection, visit our threat protection integration documentation.
To stay up-to-date with the latest announcements on Azure Security Center, read and subscribe to our blog.