Today, we’re excited to announce Azure SDK 2.8 for Visual Studio 2013 and Visual Studio 2015. This post summarizes the updates and how the new tools will improve your Azure development experience.
Azure SDK 2.8 for .NET
[download for VS 2015 | VS 2013]
- Azure Resource Manager: Authoring deployment templates in Visual Studio is easier with improved IntelliSense support for new resource providers and template language functions. The new functions used by the templates in Visual Studio, leverage platform features to reduce deployment failures by making it easier to name resources.
- Send Azure Diagnostics data to Application Insights: You can now configure Azure Diagnostics to send important log traces and metrics directly to Application Insights. Using the searching and visualization capabilities in Application Insights, you can easily identify an issue’s root cause.
- New Support for Docker: We continue to support our preview of Docker Tools for Visual Studio adding support for Windows containers.
- Updates to the Mobile Apps template: Better control over App start-up with the introduction of a new OWIN startup class.
- Announcing Microsoft Azure Storage Explorer Preview: Interested in managing Storage Blobs on non-Windows computers? We’re excited to announce a significant revision to our storage tools with the Azure Storage Explorer.
- Azure Service Fabric Tools: Azure Service Fabric Tools are available for Visual Studio 2015 today! Create, debug, deploy and upgrade Azure Service Fabric projects using the new tools in Visual Studio – Monitor, explore and manage local and remote Azure Service Fabric clusters with the new Service Fabric Explorer.
- Azure HDInsight Tools for Visual Studio: With the new update you can execute your Hive query in the cluster via HiveServer2 with almost no overhead and see the job logs in real-time. Also with the new Hive Task Execution View you can dig into your job deeper, find more details, and identify potential issues.
- Azure Data Factory Tools: Azure Data Factory Tools are now also available in Visual Studio 2015, which simplifies the Azure Data Factory authoring experience and remove on-boarding and deployment challenges.
Azure Resource Manager updates
Authoring and debugging templates is now easier with help from improved IntelliSense support to make it easier to use new resource providers and the latest template language expressions in the Azure Resource Manager template language. Visual Studio caches the schema but if you want to update to the new schemas without waiting you can simply right-click in the document window of a template and select Reload Schemas (Ctrl+Shift+J).
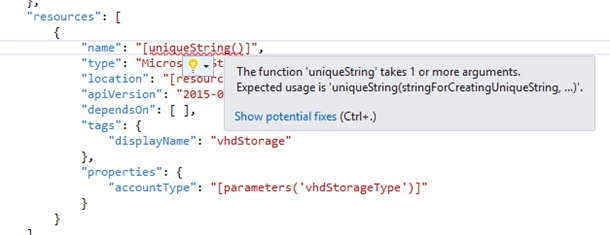
The sample templates have been updated to use new platform capabilities designed at reducing errors during initial deployments. For example, resource names can now be created automatically using a new uniqueString() function that will generate a consistent hash for a resource in a resource group across every deployment. This will reduce naming errors for globally unique resource names (collisions, regex requirements) and simplify deployment by removing the need for supplying parameter values for these resources.
The PowerShell script used for deployment of Azure Resource Manager templates has been updated to work with the new Azure PowerShell cmdlets (version 1.0 or later) that can be installed via the Web Platform Installer or the PowerShell Gallery. Note the SDK install will install these automatically. These changes allow for some simplification of the script as well as the use of basic PowerShell constructs for requiring module use. Additionally, multiple deployments can now be saved to the same resource group, which can be used to provide a history of deployments.
Send Azure Diagnostics data to Application Insights
One of the top challenges we hear from developers is how to diagnose and trouble shoot live Azure applications in production. In particular, it is difficult to troubleshoot issues that span the application and system information such as startup failures and role recycling. A lot of times the guest OS level information about the error is available through Windows event logs that the Azure Diagnostics extension can collect and transfer to storage. But once in table storage it is still hard to identify the exact error log that could be causing the issue.
By sending Azure Diagnostics data to Application Insights, you can now get insights to metrics and logs that come from both the Application Insights SDK in your application plus the system and infrastructure data coming from Azure Diagnostics all in one place showing you all the relevant data in the context of an application issue. Find out more here.
Announcing Microsoft Azure Storage Explorer Preview
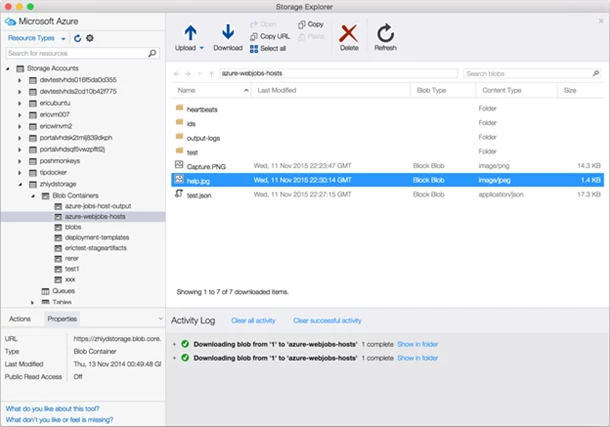
We’re excited to announce a significant revision to our storage tools with the Azure Storage Explorer (Preview) – something that has been a major source of requests and feedback from our developers needed to round out our Azure SDK toolset. Storage Explorer is a free standalone tool that supports you in building applications that use storage and diagnosing applications that use storage. For developers building applications, this tool makes it easy to connect to your storage accounts – either by simply signing in with your Microsoft Account, Organizational Account (including 2FA), or direct storage account name and key – and browsing all the accounts in all your subscriptions.
At this point you can quickly create containers, upload file content into containers, download files, set properties and metadata, and even create and get SAS keys to control access. For developers diagnosing applications, you can quickly search for containers and individual blobs, and inspect a number of things from the content itself to the metadata and properties on the blobs, and this helps narrow down issues between your application/script and the storage its working with. Because this tool is lightweight and standalone, you can copy it into a number of environments for quick actions and troubleshooting. We put a lot of attention into working with large subscriptions and handling large amounts of content, so the explorer can meet your growing demands.
There are a few notable features of this Storage Explorer. First, it has full support for the new ARM based subscriptions and storage accounts, as well as the classic accounts, so you have full access to all storage accounts in Azure. Next we enable all forms of sign in which makes it faster to get connected. And possibly the most exciting is we offer lightweight standalone versions for the Windows and Mac, increasing the number of places you can use this tool. Currently this preview focuses on the Blob service in storage, and you will see the majority of functionality center around Blobs. We have minimal support for creating and deleting Tables and Queues, however that support will be coming soon pending feedback from this preview.
Please download Azure Storage Explorer (Preview) for Windows and Mac today from storageexplorer.com and let us know that you think using Send-a-Smile!
New support for Docker
We continue to support our preview of Docker Tools for Visual Studio adding support for Windows 2016 Containers, with windows 2016 Nano Containers coming soon. We’ve also recently released yo docker, incorporating your feedback for more script-based tooling containerizing ASP.NET, Node.js, and GO.

Azure Mobile Apps improvements
The project template for App Service Mobile Apps has been updated to include an OWIN startup class. This reflects the breaking changes introduced in version 0.2.575 of the Microsoft.Azure.Mobile.Server NuGet package – the developer now has full control of startup. You can read more about these changes in the release notes for that SDK version. The template has also been moved to use OWIN self-hosting.
Azure Service Fabric Tooling
If you want to get started building micro-services using Azure Service Fabric and Visual Studio, today you can download the Microsoft Azure Service Fabric SDK Preview. This includes the Azure Service Fabric runtime and SDK along with Visual Studio tools that make getting started with Service Fabric easy. These tools enable you to create new Service Fabric applications by using a variety of service templates. You can then easily debug, deploy, version and upgrade your new Service Fabric application.
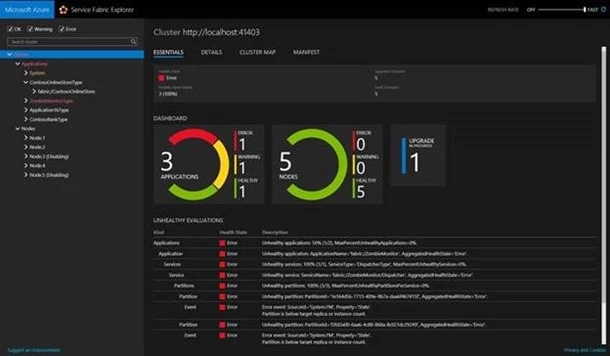
When you first run your application, a local cluster is created for you which enables you to debug your it locally. You can use Cloud Explorer to view the applications and nodes in your local or remote cluster as well as launch the new Service Fabric Explorer. Service Fabric Explorer is a modern, web-based tool for monitoring Service Fabric deployments and upgrades. You can also use it to explore details for all service fabric nodes, applications, services, partitions and replicas. Service Fabric Explorer enables you perform actions against the different artifacts of the cluster, such as deleting an application or disabling a node.
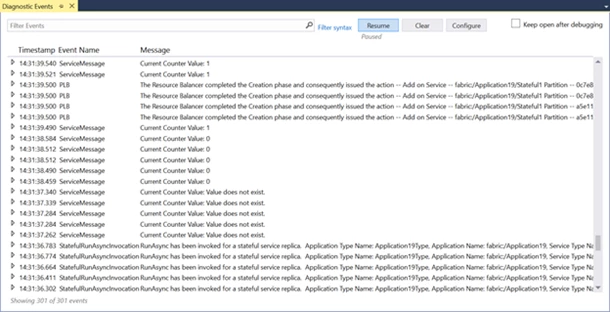
The Azure Service Fabric tools include a Diagnostic Events viewer that, when you start your application, automatically streams ETW events generated by the Service Fabric runtime, its built-in programming models, and your application code directly into Visual Studio. This gives you a single view of all events that may affect your micro-service regardless of the provider generating them.
Lastly, you can use an Azure Resource Group project to create a Service Fabric cluster hosted in Azure by using a supplied JSON template. You can modify this template to suit your needs.
Azure Data Factory Tools
Data Factory Tools are now also available in Visual Studio 2015. Our goal is to simplify the Azure Data Factory authoring experience and remove on-boarding and deployment challenges. The Azure Data Factory Tools improve productivity and efficiency for both new and advanced users with tailored experiences and rich tooling. With this release, customers can interactively author and deploy data pipelines using the rich Visual Studio interface. See theAzure Data Factory blog post for more information about these tools.
Azure HDInsight Tools for Visual Studio
The HDInsight team has released some updates for HDInsight developers using Visual Studio. This section will elaborate on some of the Visual Studio improvements made for HDInsight developers.
Faster path Hive execution via HiveServer2
Currently, the information HDInsight Tools for Visual Studio exposes is very limited and require a long time to get. For example, after submitting a Hive job, you can only see a “progress rate” without any further detail for the submitted Hive job. Also, the existing submission mechanism introduces additional submission overhead so it takes at least one minute to find a very simple error because the job is submitted via WebHCat (also known as Templeton). In order to solve this, we introduced this feature so you can execute Hive jobs directly in the cluster through HiveServer2 with almost no overhead, while having the full information during query execution without RDP/SSH-ing to your Windows/Linux clusters – and most importantly, enjoy the great experience provided by HDInsight Tools for Visual Studio to see Hive on Tez graphs, and the Task details!
[Note: This feature only works for HDInsight clusters 3.2 and above.]
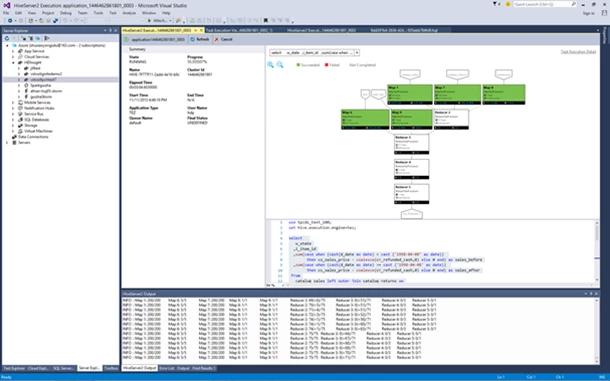
Task Execution View for Hive on Tez jobs
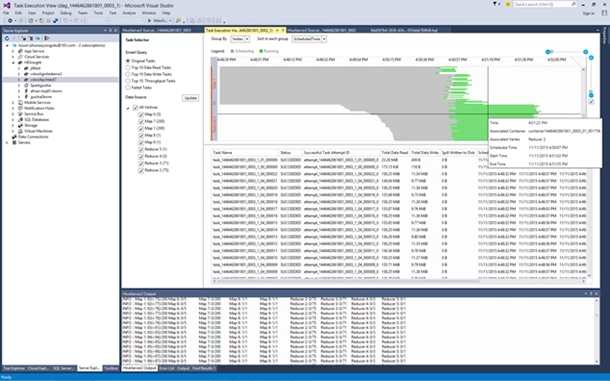
Currently there’s no way to get structured and visualized information for Hive jobs and it’s hard to get deeper insights for their job. We develop the Task Execution View for Hive on Tez jobs so users can get deeper details into their jobs, and if there are some job performance issues you can look at your job for further details.
Basically it helps users to see the how each task operates and the detailed information about each task (data read/write, schedule/start/end time, etc.) so you can adjust the configurations of your job or the system architecture based on the visualized information.
Summary
If you don’t already have an Azure account, you can sign-up for a free trial and start using all of the above features today. Then visit the Azure Developer Center to learn more about how to build apps with it. Please submit bugs through Connect, suggestions through UserVoice, and quick thoughts or ideas through Send-a-smile in the Visual Studio IDE.
Credits
This blog post is a collaboration of multiple people. Big thanks to Jason R. Shaver, Matthew Henderson, and Vijay Paruchuri.
