This blog post is co-authored by Xiaoyong Zhu, Nile Wilson (Microsoft AI CTO Office), Ben Cutler (Project Natick), and Lucas Joppa (Microsoft Chief Environmental Officer).
At Microsoft, we put our cloud and artificial intelligence (AI) tools in the hands of those working to solve global environmental challenges, through programs such as AI for Earth. We also use these same tools to understand our own interaction with the environment, such as the work being done in concert with Project Natick.
Project Natick seeks to understand the benefits and difficulties in deploying subsea datacenters worldwide; it is the world’s first deployed underwater datacenter and it was designed with an emphasis on sustainability. Phase 2 extends the research accomplished in Phase 1 by deploying a full-scale datacenter module in the North Sea, powered by renewable energy. Project Natick uses AI to monitor the servers and other equipment for signs of failure and to identify any correlations between the environment and server longevity.
Because Project Natick operates like a standard land datacenter, the computers inside can be used for machine learning to provide AI to other applications, just as in any other Microsoft datacenter. We are also using AI to monitor the surrounding aquatic environment, as a first step to understanding what impact, if any, the datacenter may have.
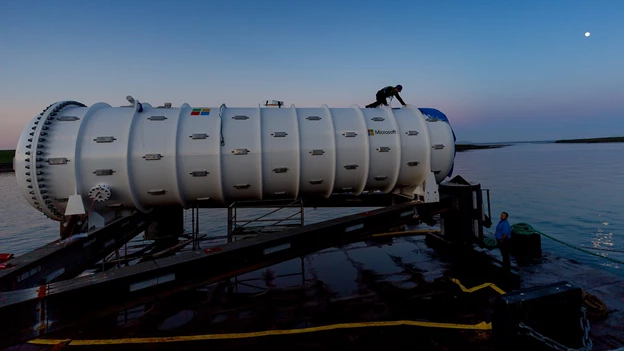
Figure 1. Project Natick datacenter pre-submergence. Photo by Scott Eklund/Red Box Pictures.
Monitoring marine life using object detection
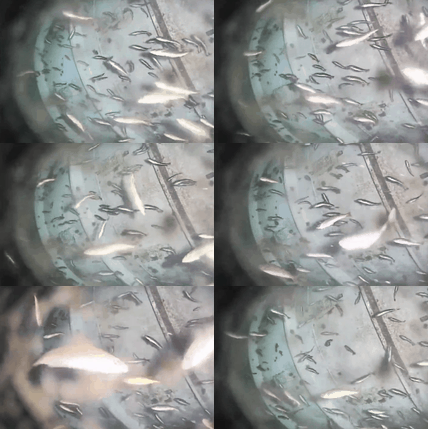
The Project Natick datacenter is equipped with various sensors to monitor server conditions and the environment, including two underwater cameras, which are available as live video streams (check out the livestream on the Project Natick homepage). These cameras allow us to monitor the surrounding environment from two fixed locations outside the datacenter in real time.
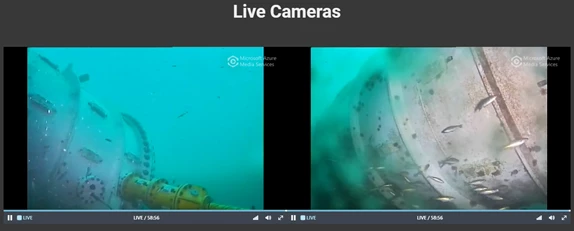
Figure 2. Live camera feed from Project Natick datacenter (Source: Project Natick homepage)
We want to count the marine life seen by the cameras. Manually counting the marine life in each frame in the video stream requires a significant amount of effort. To solve this, we can leverage object detection to automate the monitoring and counting of marine life.

Figure 3. From the live camera feed, we observe a variety of aquatic life, including left, ray; middle, fish; right, arrow worm
In each frame, we count the number of marine creatures. We model this as an object detection problem. Object detection combines the task of classification with localization, and outputs both a category and a set of coordinates representing the bounding box for each object detected in the image. This is illustrated in Figure 4.
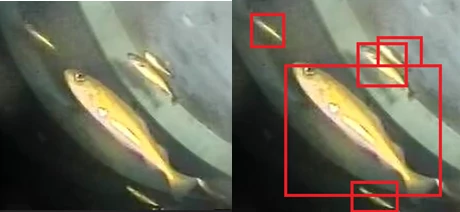
Figure 4. Object detection tasks in computer vision. left, input image; right, object detection with bounding boxes
How to choose an object detection model
Over the past few years, many exciting deep learning approaches for object detection have emerged. Models such as Faster R-CNN use a two-stage procedure to first propose regions containing some object, followed by classification of the proposed region and adjusting the proposed bounding box. Using a one-stage approach, models such as You Only Look Once (YOLO) and Single Shot MultiBox Detector (SSD), or RetinaNet with focal loss, consider a fixed set of boxes for detection and skip the region proposal stage, which are usually faster compared with two-stage detectors.
To achieve real-time object detection for videos, we need to balance between speed and accuracy. From the video stream, we observed that there are only a few types of aquatic life that come within view—fish, arrow worms, and rays. The limited number of animal categories allows us to choose a relatively light-weight object detection model which can be run on CPUs.
By comparing the speed and accuracy of different deep learning model architectures, we chose to use SSD with MobileNet as our network architecture.
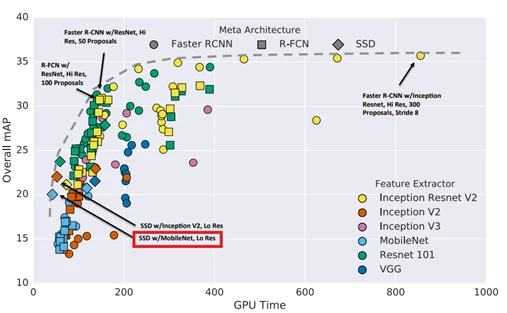
Figure 5. Object detection approaches (tradeoffs between accuracy and inference time). Marker shapes indicate meta-architecture and colors indicate feature extractor. Each (meta-architecture, feature extractor) pair corresponds to multiple points on this plot due to changing input sizes, stride, etc. (source)
An AI Oriented Architecture for environmental monitoring
AI Oriented Architecture (AOA) is a blueprint for enterprises to use AI to accelerate digital transformation. An AOA enables organizations to map a business solution to the set of AI tools, services and infrastructure that will enable them to realize the business solution. In this example, we use an AI Oriented Architecture to design a deep learning solution for environmental monitoring.
Figure 6 shows an AI Oriented Architecture for monitoring marine life near the underwater datacenter. We first save the streamed video file from Azure Media Service using OpenCV, then label the video frames using VoTT and put the labelled data in Azure Blob Storage. Once the dataset is labelled and placed in Azure Blob Storage, we start training an object detection model using Azure. After we have trained the model, we deploy the model to the Natick datacenter, so the model can run inference on the input stream directly. The result is then either posted to PowerBI or displayed directly in the UI for intuitive debugging. Each of these steps is discussed in the following sections.
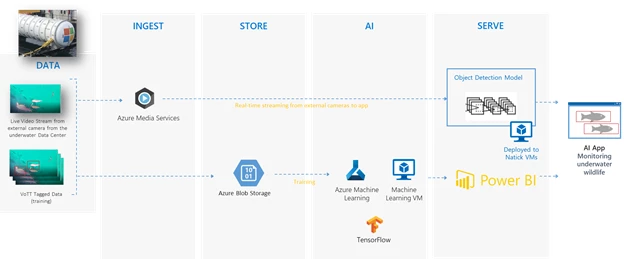
Figure 6. AI Oriented Architecture for detecting underwater wildlife
The key ingredients of the environment monitoring solution include the following:
- Dataset
- Labelling data using the Visual Object Tagging Tool (VoTT)
- Azure Blob Storage to store the dataset for easy access during training and evaluation
- Tools
- TensorFlow Object Detection API
- Azure
- Azure GPU cluster, or the CPU cluster available in Project Natick Datacenter
- Development and deployment tools
- Visual Studio Tools for AI, an extension to develop and debug models in the integrated development environment (IDE)
Labelling data for object detection
The first step is to label the video files. The video streams are publicly available (here and here), which can be saved to local mp4 files using OpenCV. To facilitate the labelling process, we then label the mp4 video files using the open source tool VoTT developed by Microsoft. VoTT is a commonly used tool built for labelling objects in videos.
For this problem, we scope it to monitor fish and arrow worms. We labelled 200 images in total for the two classes (arrow worms and fish), and the labelled data is available in the GitHub repository.
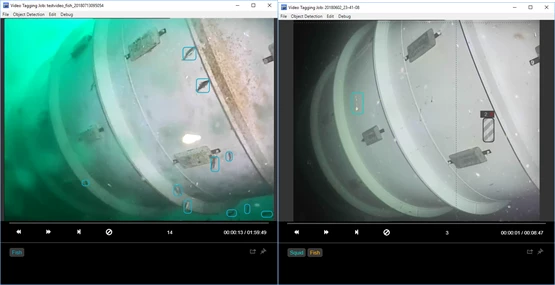
Figure 7. Sample image of the labelled file
Training an object detection model using Azure
We used TensorFlow to perform object detection. TensorFlow comes with the TensorFlow Object Detection API which has some built-in network architectures, making it easy to train a neural network to recognize underwater animals.
Because the dataset is small (200 images in total for arrow worms and fish), the problem is how to train an accurate enough object detector with limited labelled data and avoid overfitting. We train the object detector for 1,000 steps, initialized from COCO weights, with strong data augmentation such as flipping, color adjustment (including hue, brightness, contrast, and saturation), as well as bounding box jittering, to make sure the model can generalize well under most of the conditions.
We also use more anchor ratios, in particular 0.25:1 and 4:1, in addition to the regularly used anchor ratios (such as 2:1), to make sure the model can capture most of the animals. This is especially useful to capture arrow worms since they are long and narrow in shape.
The code and object detection configurations are available in this GitHub repository.

Figure 8. Training loss for the underwater creature detector
Deploying the model to the Project Natick datacenter
Another question we asked was – can we deploy the model to the Natick datacenter to monitor the wildlife teeming around the data center?
We chose to use CPUs to process the input videos and tested locally to make sure it works well. However, the default TensorFlow pre-built binary does not have optimizations such as AVX or FMA built-in to fully utilize modern CPUs. To better utilize the CPUs, we built the TensorFlow binary from source code, turning on all the optimization for Intel CPU by following Intel’s documentation. With all the optimization, we can increase the processing speed by 50 percent from around two frame per second to three frame per second. The build command is like below:
bazel build --config=mkl -c opt --copt=-mavx --copt=-mavx2 --copt=-mfma --copt=-mavx512f --copt=-mavx512pf --copt=-mavx512cd --copt=-mavx512er --copt="-DEIGEN_USE_VML"

//tensorflow/tools/pip_package:build_pip_package
Real-time environmental monitoring with Power BI
Environmental scientists and aquatic scientists may benefit from a more intuitive way of monitoring the statistics of the underwater datacenter, such that they can quickly gain insight as to what is going on, through powerful visualization via Power BI.
Power BI has a notion of real-time datasets which provides the ability to accept streamed data and update dashboards in real time. It is intuitive to call the REST API to post data to the Power BI dashboard with a few lines of code:
# REST API endpoint, given to you when you create an API streaming dataset
# Will be of the format: https://api.powerbi.com/beta//datasets/< dataset id>/rows?key=
REST_API_URL = ' *** Your Push API URL goes here *** '
# ensure that timestamp string is formatted properly
now = datetime.strftime(datetime.now(), "%Y-%m-%dT%H:%M:%S%Z")
# data that we're sending to Power BI REST API
data = '[{{ "timestamp": "{0}", "fish_count": "{1}", "arrow_worm_count": "{2}" }}]'.format(now, fish_count, arrow_worm_count)
req = urllib2.Request(REST_API_URL, data)
response = urllib2.urlopen(req)
Because the animals may move quickly, we need to carefully balance between capturing data for many frames in short succession, sending to the Power BI dashboard, and consuming compute resources. We chose to push the analyzed data (for example, fish count) to Power BI three times per second to achieve this balance.

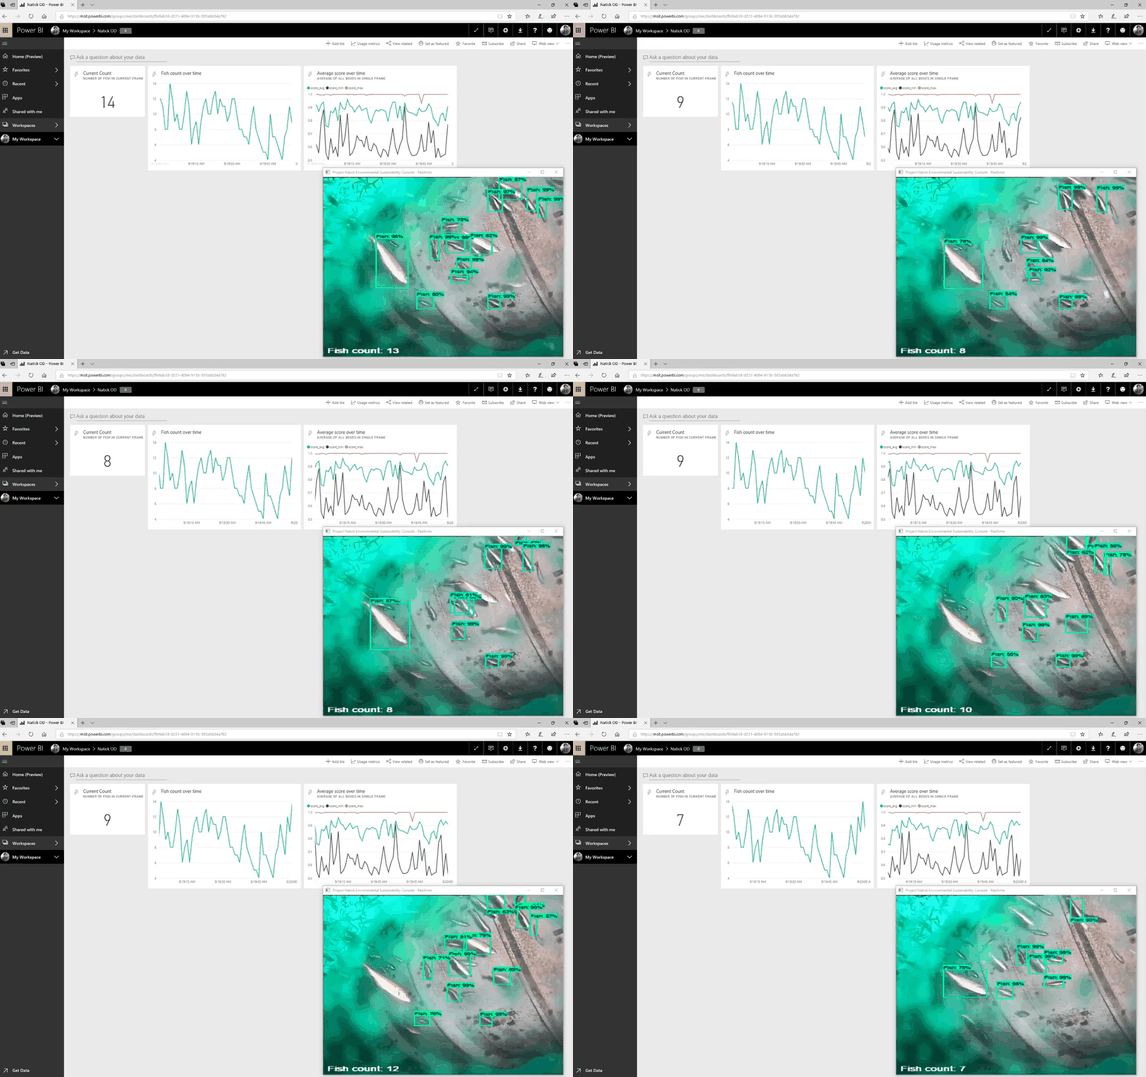
Figure 9. Power BI dashboard running together with the video frame. Bottom: GIF showing the E2E result
Summary
Monitoring the environmental impact is an important topic, and AI can help make this process more scalable, and automated. In this post, we explained how we developed a deep learning solution for environment monitoring near the underwater data center. In this solution, we show how to ingest and store the data, and train an underwater animal detector to detect the marine life seen by the cameras. The model is then deployed to the machines in the data center to monitor the marine life. At the same time, we also explored how to analyze the video streams and leverage Power BI’s streaming APIs to monitor the marine life over time.
If you have questions or comments, please leave a message on our GitHub repository.

