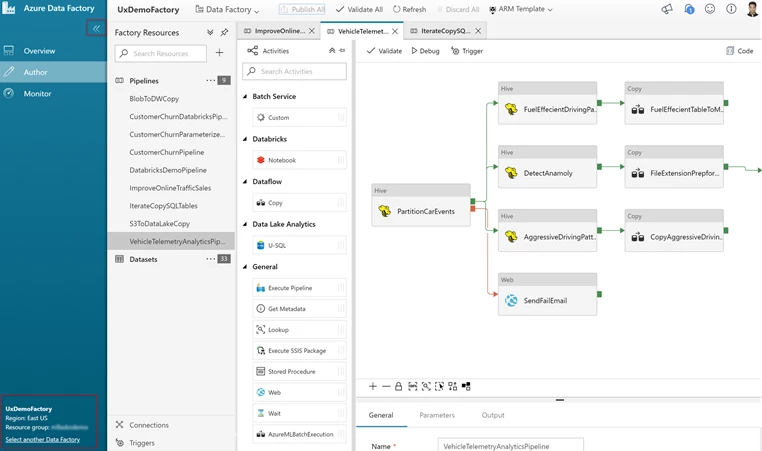
With Azure Data Factory (ADF) visual tools, we listened to your feedback and enabled a rich, interactive visual authoring and monitoring experience. It allows you to iteratively create, configure, test, deploy and monitor data integration pipelines without any friction. The main goal of the ADF visual tools is to allow you to be productive with ADF by getting pipelines up and running quickly without requiring to write a single line of code.
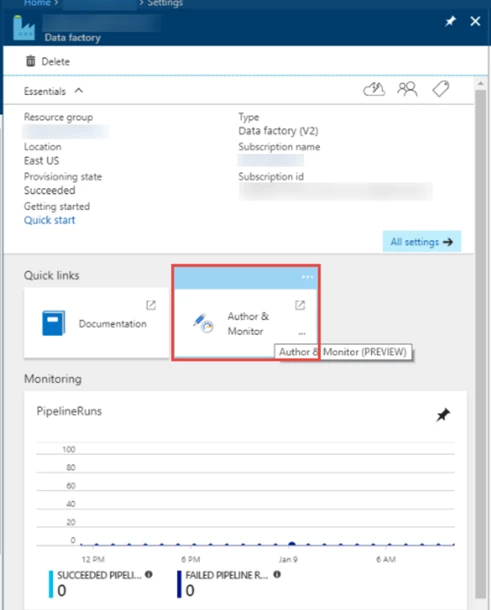
We continue to add new features to increase productivity and efficiency for both new and advanced users with intuitive experiences. You can get started by clicking the Author and Monitor tile in your provisioned v2 data factory blade.
Check out some of the exciting new features enabled with data factory visual tools since public preview (January 2018):
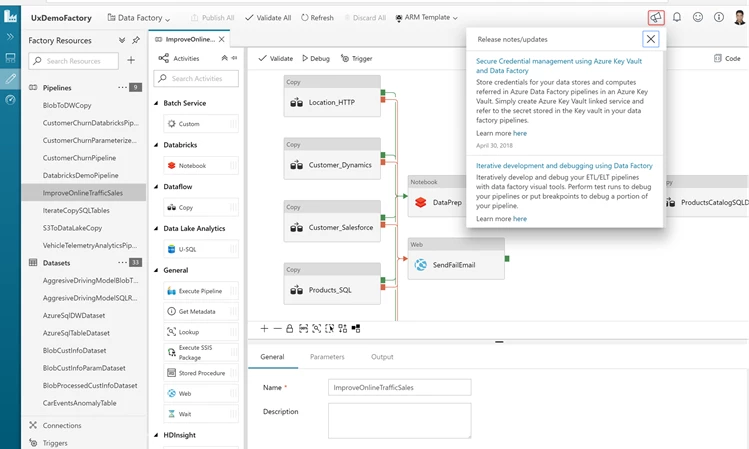
Latest data factory updates
Follow exciting new updates to the data factory service.
View Data Factory deployment region, and resource group. Then, switch to another data factory that you have access to.
Visual authoring
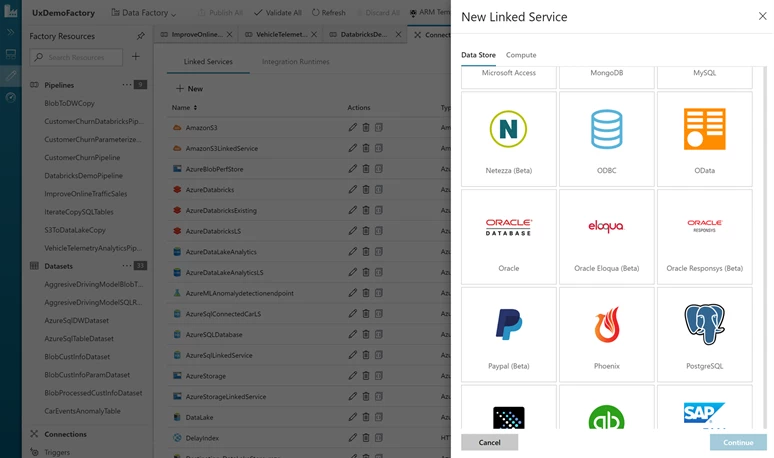
More data connectors
Ingest data at scale from more than 70 on-premises/cloud data sources in a serverless fashion.
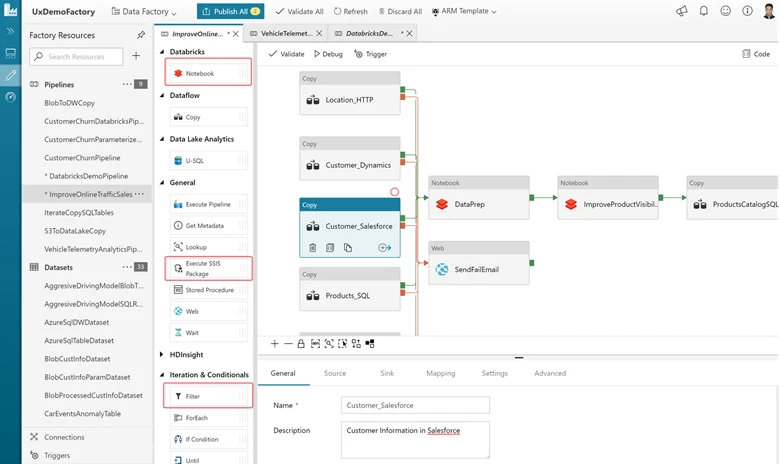
New activities in toolbox
- Notebook Activity: Ingest data at scale using more than 70 on-premises/cloud data sources and prepare/transform the ingested data in Azure Databricks as a Notebook activity step in data factory pipelines.
- Filter Activity: Filter data ingested from more than 70 data sources.
- Execute SSIS Package: Execute SSIS packages on Azure SSIS Integration Runtime in your data factory.
- Look up Activity: Lookup activity now supports retrieving a dataset from any of 70+ ADF-supported data sources.
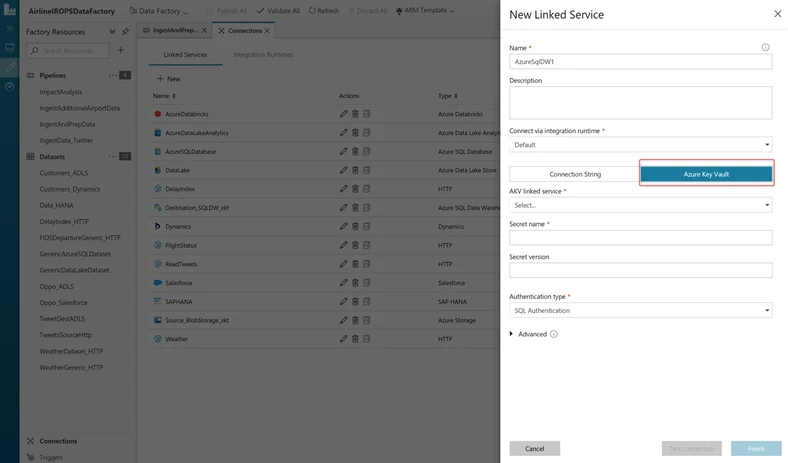
Azure Key Vault integration
Store credentials for your data stores and computes referred in Azure Data Factory pipelines in an Azure Key Vault. Simply create Azure Key Vault linked service and refer to the secret stored in the Key vault in your data factory pipelines.
Iterative development and debugging
Iteratively develop and debug your ETL/ELT pipelines with data factory visual tools. Perform test runs to debug your pipelines or put breakpoints to debug a portion of your pipeline.
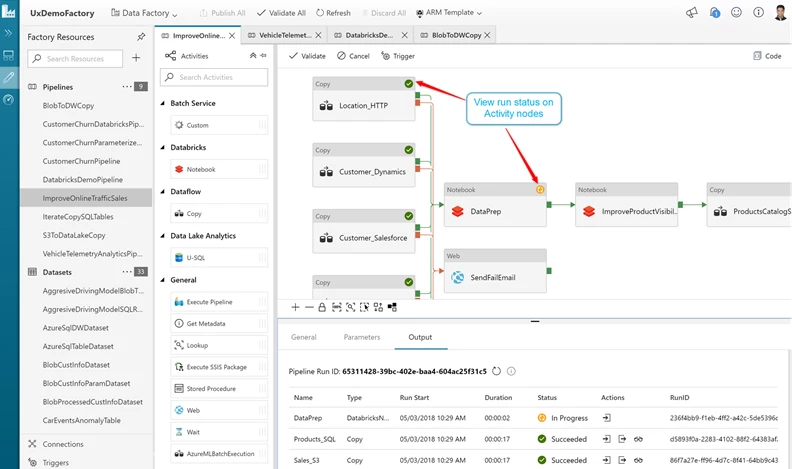
View test run (debug) status on activity nodes
You can now view the the last test run status on activity nodes on the pipeline canvas.
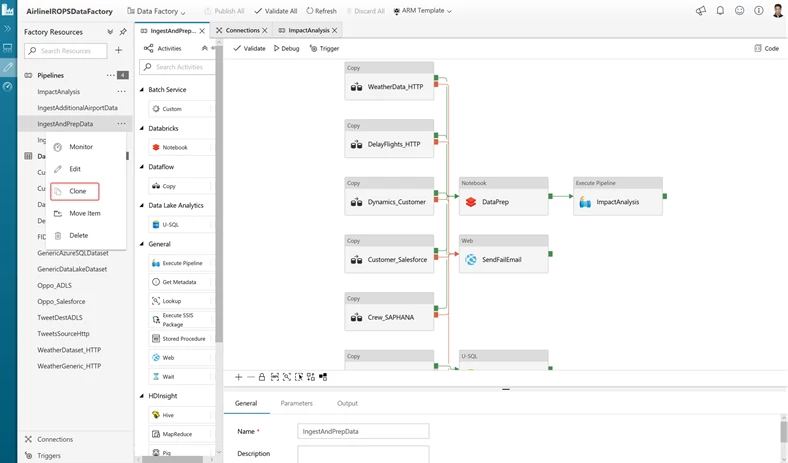
Clone pipelines and activities
You can now clone an entire pipeline or an activity on the pipeline canvas. This will create an identical copy of the entire pipeline or an activity on the pipeline canvas including the settings.
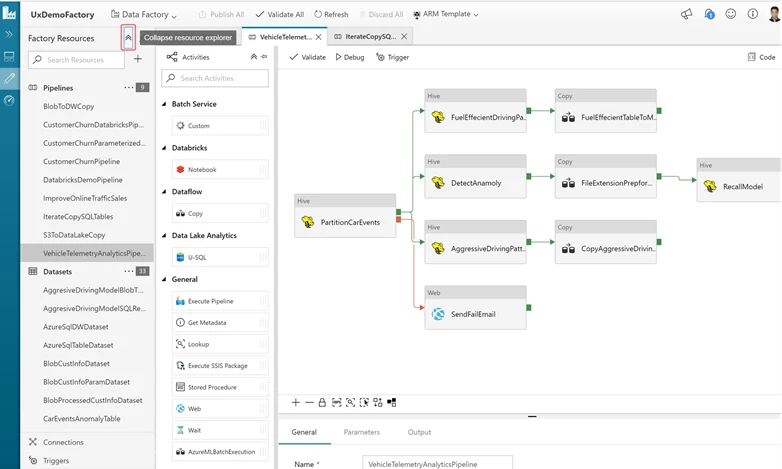
New Resource Explorer actions
You can now expand/collapse all the resource explorer entities (pipelines, datasets) with a click of a button. You can also adjust the width of the ‘Resource Explorer’ by dragging it to the left/right.
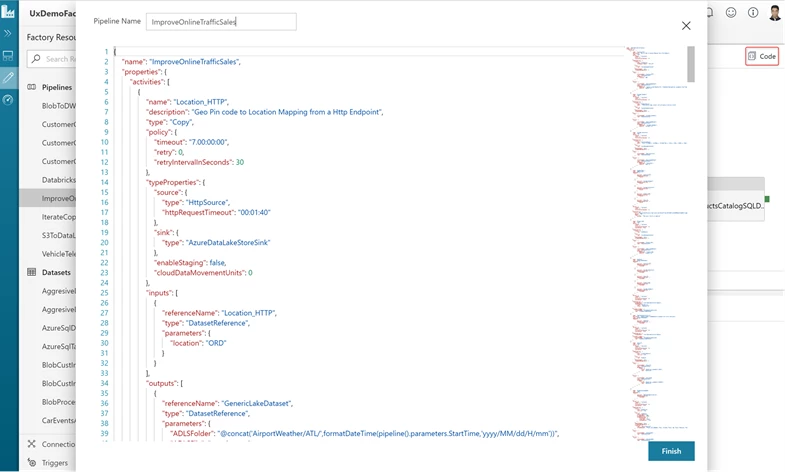
View/edit Code for your data factory pipelines
You can now view and edit JSON for your data factory pipelines. Simply click the ‘Code’ icon to view your JSON, make edits directly to your JSON and click ‘Finish.’ You can then ‘Publish’ your changes to the data factory service.
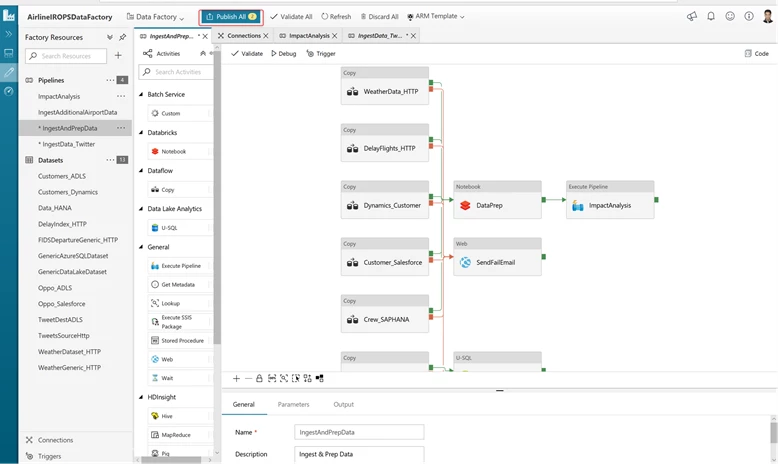
View pending changes to be published to data factory
Add/edit/delete pipelines, triggers, datasets, linked services, integration runtimes and see the number of pending changes to be published to the data factory service.
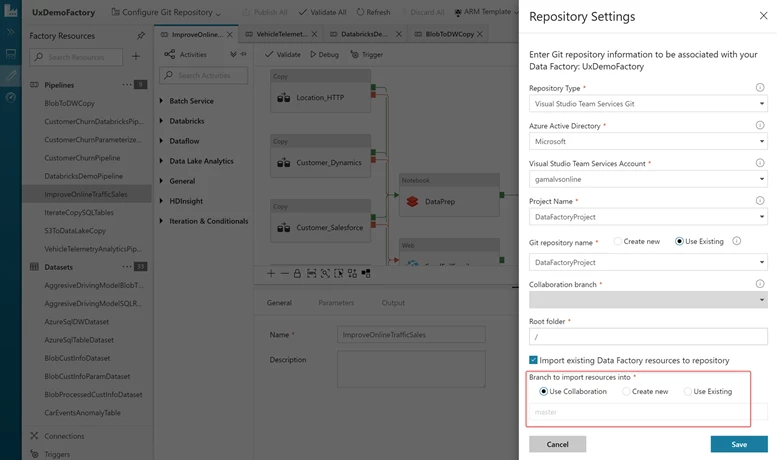
Import data factory resources to any branch in your GIT repository
You can now choose the collaboration branch (generally ‘master’), create a new branch or use any existing branch to import your data factory resources while setting up the VSTS GIT repository. This is very useful in case you don’t have access to the collaboration branch and want the data factory resources imported in any other develop/feature branch.
Visual Monitoring
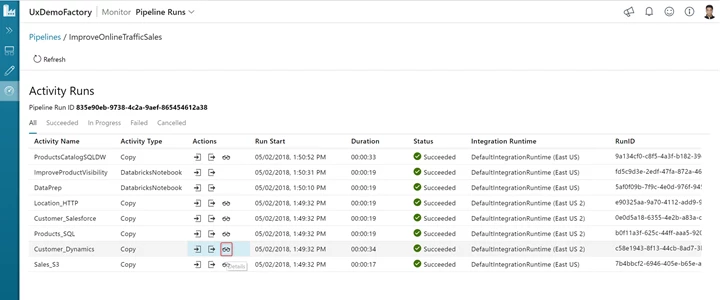
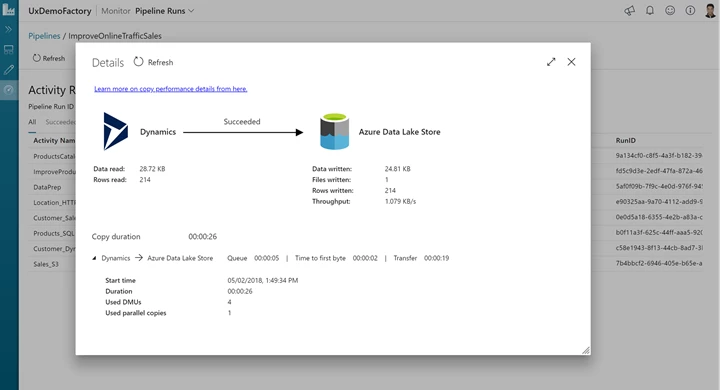
Monitor Copy real time progress
Click the ‘Details’ icon to view your copy activity continuous progress. Simply click ‘Refresh’ to get the latest statistics.
Alerts
Create alerts to be notified on different data factory metrics. For example: pipeline, activity, trigger failure runs. Clicking ‘Alerts’ will take you to the ‘Monitor’ tab in azure portal where you can create alerts on data factory metrics.

Metrics
Visualize your data factory metrics and see the pattern over days, months, and more in a simple graphical interface. Clicking ‘Metrics’ will take you to the ‘Monitor’ tab in azure portal where you can visualize your data factory metrics.

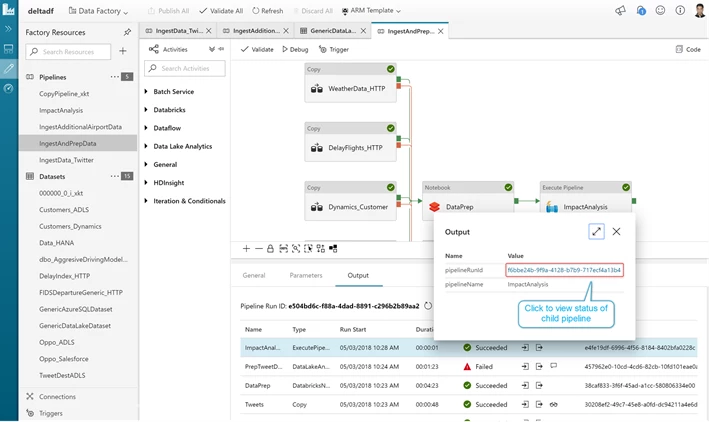
View run status of child pipelines
If your pipeline triggers other child pipelines using ‘Execute Pipeline’ activity in data factory, you can now view the status of child pipelines from the parent pipeline. Simply click the ‘Output’ icon under the ‘Actions’ column and click on the ‘pipelineRunId’ field.
Easily copy ‘runid’ for debugging purpose
You can now copy the ‘runid’ of your pipeline, activity runs easily for debugging purposes. Simply select and copy it in case you need to provide it to azure support for debugging purposes.

Our goal is to continue adding features and improve the usability of Data Factory tools. Get started building pipelines easily and quickly using Azure Data Factory. If you have any feature requests or want to provide feedback, please visit the Azure Data Factory forum.

