Yes, you read that correctly. We have just released an Application Insights chart widget for VSTS dashboards!
It’s ok, you can go ahead and say it, this has been a long time coming. We heard all of the fans from our previous metric widget very clearly that this was something almost everyone wanted. But for quite awhile we also had other, even-higher-priority things that our user base really wanted and needed (you know, little things like bringing the product to general availability, and developing the whole Usage Analytics functionality area). The good news is that we never forgot about all of the asks for this feature set and it’s finally here.
How do I get the new widget?
If you already have our previous metric widget installed, you don’t have to do anything. You should already have the new chart widget available. If you’re starting from scratch you can download the Application Insights widget from the Visual Studio marketplace.
How does the new widget work?
Simply click the edit button on your VSTS dashboard, then click on the add (+) button. You’ll see a list of available tiles, including the previously available Application Insights metric widget as well as the new chart widget:
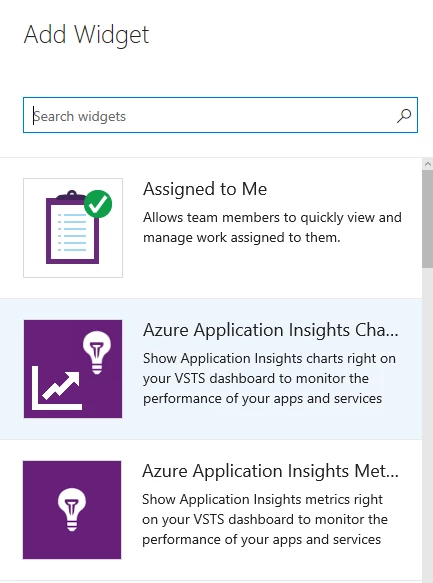
Once the widget has been added to your dashboard, open the configuration, provide the application ID and API key, and then select the metric you want to track with the widget as well as particulars like time range and granularity. When you’re finished you’ll get a lovely chart that will look something like this:
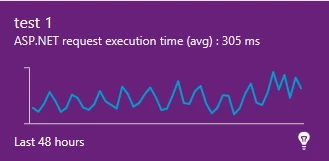
That’s it. You can choose from line (default), area, or column charts as appropriate for the type of data you intend to return. The chart is also resizable and more detail is added as the size increases. So, you can get a small summary chart or a large detailed chart complete with timestamped axis labels. You can always hover over any data point to get a tooltip that will display the detailed data.
The current chart widget does not provide threshold warnings the way that the metric widget does. This is on purpose for this first iteration, as there was some debate as to how we should determine when a threshold has been crossed. For instance, if you’re displaying average request execution time (as in the example graphic above), do you want to show a critical/warning condition if any of the values in the average cross that threshold or is it if the average value itself exceeds the limit? Do you only trigger the condition if it’s currently exceeding the limit or should it display if any value in the time range of the chart meets the condition? The possibilities are much more complex than with the metric widget, so we have not added this functionality yet to avoid confusion. If you have specific feedback on this feature, please let us know. We always welcome your input.
Next Steps
As mentioned before, we will consider adding the threshold feature to this widget so long as we feel that we can establish logical parameters that make sense for the majority of the user base. Additionally, we are still looking into an Application Analytics (query-based) widget as several users have mentioned that this would be useful as well. Please go upvote these features if they are important to you.
We have some more great devops functionality coming your way soon. Thanks for reading!
Grez
_______________
As always please share your ideas for new or improved features on the Application Insights UserVoice page. For any questions visit the Application Insights Forum.