This post is co-authored by Tim Burrell, Principal Security Engineering Manager and Dotan Patrich, Principal Software Engineer.
As cyberattacks become more complex and harder to detect. The traditional correlation rules of a SIEM are not enough, they are lacking the full context of the attack and can only detect attacks that were seen before. This can result in false negatives and gaps in the environment. In addition, correlation rules require significant maintenance and customization since they may provide different results based on the customer environment.
Advanced Machine Learning capabilities that are built in into Azure Sentinel can detect indicative behaviors of a threat and helps security analysts to learn the expected behavior in their enterprise. In addition, Azure Sentinel provides out-of-the-box detection queries that leverage the Machine Learning capabilities of Kusto query language that can detect suspicious behaviors in such as abnormal traffic in firewall data, suspicious authentication patterns, and resource creation anomalies. The queries can be found in the Azure Sentinel GitHub community.
Below you can find three examples for detections leveraging built in Machine Learning capabilities to protect your environment.
Time series analysis of authentication of user accounts from unusual large number of locations
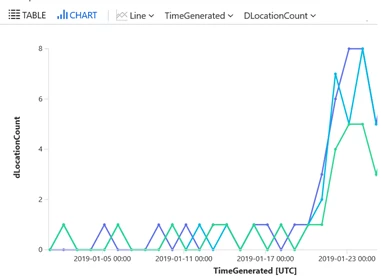
A typical organization may have many users and many applications using Azure Active Directory for authentication. Some applications (for example Office365 Exchange Online) may have many more authentications than others (say Visual Studio) and thus dminate the data. Users may also have a different location profile depending on the application. For example high location variability for email access may be expected, but less so for development activity associated with Visual Studio authentications. The ability to track location variability for every user/application combination and then investigate just some of the most unusual cases can be achieved by leveraging the built in query capabilities using the operators make-series and series_fit_line.
SigninLogs
| where TimeGenerated >= ago(30d)
| extend  locationString= strcat(tostring(LocationDetails["countryOrRegion"]), "/", tostring(LocationDetails["state"]), "/", tostring(LocationDetails["city"]), ";")
| project TimeGenerated, AppDisplayName , UserPrincipalName, locationString
| make-series dLocationCount = dcount(locationString) on TimeGenerated in range(startofday(ago(30d)),now(), 1d)
by UserPrincipalName, AppDisplayName
| extend (RSquare,Slope,Variance,RVariance,Interception,LineFit)=series_fit_line(dLocationCount)
| where Slope >0.3

Creation of an anomalous number of resources
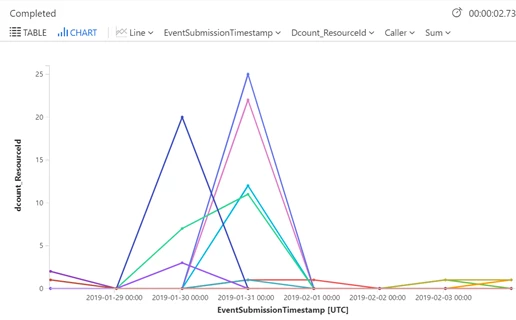
Resource creation in Azure is a normal operation in the environment. Operations and IT teams frequently spin up environments and resources based on the organizational needs and requirements. However, an anomalous creation of resource by users that don’t have permissions or aren’t supposed to create these resources is extremely interesting. Tracking anomalous resources creation or suspicious deployment activities in azure activity log can provide a lead to spot an execution technique done by an attacker.
AzureActivity
| where TimeGenerated >= ago(30d)
| where OperationName == "Create or Update Virtual Machine" or OperationName == "Create Deployment"
| where ActivityStatus == "Succeeded"
| make-series num = dcount(ResourceId)  default=0 on EventSubmissionTimestamp in range(ago(30d), now(), 1d) by Caller
| extend  outliers=series_outliers(num, "ctukey", 0, 10, 90)
| project-away num
| mvexpand outliers
| where outliers > 0.9
| summarize by Caller
Firewall traffic anomalies
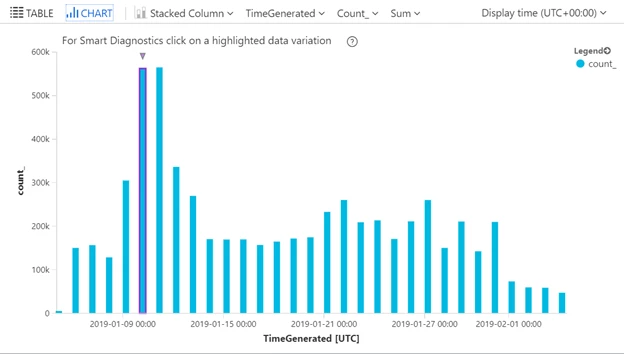
Firewall traffic can be an additional indicator of a potential attack in the organization. The ability to establish a baseline that represents the usual firewall traffic behavior on a weekly or an hourly basis can help point out the anomalous increase in traffic. Using the built-in capabilities in the Log Analytics query language can point directly to the traffic anomaly and be investigated.
CommonSecurityLog
| summarize count() by bin(TimeGenerated, 1h)

With Azure Sentinel, you can create the above advanced detection rules to detect anomalies and suspicious activities in your environment, create your own detection rules or leverage the rich GitHub library that contains detections written by Microsoft security researchers.

