This blog is co-authored by Nick Lopez, Technical Advisor at Microsoft.
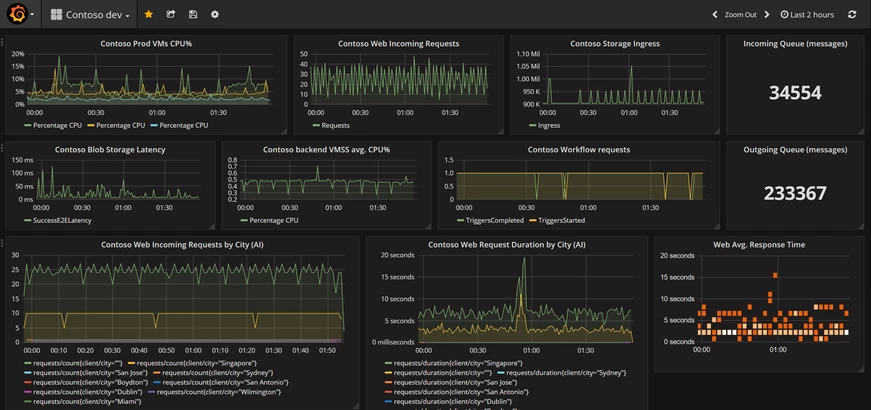
Grafana is one of the popular and leading open source tools for visualizing time series metrics. Grafana has quickly become the preferred visualization tool of choice for developers and operations teams for monitoring server and application metrics. Grafana dashboards enable operation teams to quickly monitor and react to performance, availability, and overall health of the service. You can now also use it to monitor Azure services and applications by leveraging the Azure Monitor data source plugin, built by Grafana Labs. This plugin enables you to include all metrics from Azure Monitor and Application Insights in your Grafana dashboards. If you would like to quickly setup and test Grafana with Azure Monitor and Application Insights metrics, we recommend you refer to the Azure Monitor Documentation.

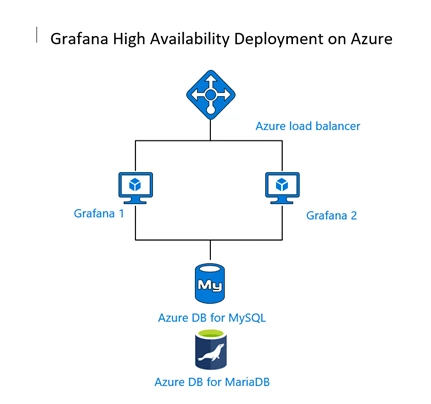
Grafana server image in Azure Marketplace provides a great QuickStart deployment experience. The image provisions a virtual machine (VM) with a pre-installed Grafana dashboard server, SQLite database and the Azure plugin. The default setup with a single VM deployment is great for a proof of concept study and testing. For high availability of monitoring dashboards for your critical applications and services, it’s essential to think of high availability of Grafana deployments on Azure. The following is the proposed and proven architecture to setup Grafana for high availability and security on Azure.
Setting up Grafana for production deployments

Grafana Labs recommends setting up a separate highly available shared MySQL server for setting up Grafana for high availability. The Azure Database for MySQL and MariaDB are managed relational database services based on the community edition of MySQL and the MariaDB database engine. The service provides high availability at no additional cost, predictable performance, elastic scalability, automated backups and enterprise grade security with secure sockets layer (SSL) support, encryption at rest, advanced threat protection, and VNet service endpoint support. Utilizing a remote configuration database with Azure Database for MySQL or Azure Database for MariaDB service allows for horizontal scalability and high availability of Grafana instances required for enterprise production deployments.
Leveraging Bitnami Multi-Tier Grafana templates for production deployments
Bitnami lets you deploy a multi-node, production ready Grafana solution from the Azure Marketplace with just a few clicks. This solution uses several Grafana nodes with a pre-configured load balancer and Azure Database for MariaDB for data storage. The number of nodes can be chosen at deployment time depending on your requirements. Communication between the nodes and the Azure Database for MariaDB service is also encrypted with SSL to ensure security.
A key feature of Bitnami’s Grafana solution is that it comes pre-configured to provide a fault-tolerant deployment. Requests are handled by the load balancer, which continuously tests nodes to check if they are alive and automatically reroutes requests if a node fails. Data (including session data) is stored in the Azure Database for MariaDB and not on the individual nodes. This approach improves performance and protects against data loss due to node failure.
For new deployments, you can launch Bitnami Grafana Multi-Tier through the Azure Marketplace!
Configuring existing installations of Grafana to use Azure Database for MySQL service
If you have an existing installation of Grafana that you would like to configure for high availability, you can use the following steps that demonstrate configuring Grafana instance to use Azure Database for MySQL server as the backend configuration database. In this walkthrough, we will be using an example of Ubuntu with Grafana installed and configure Azure Database for MySQL as a remote database for Grafana setup.
- Create an Azure Database for MySQL server with the General Purpose tier which is recommended for production deployments. If you are not familiar with the database server creation, you can read the QuickStart tutorial to familiarize yourself with the workflow. If you are using Azure CLI, you can simply set it up using az mysql up.
- If you have already installed Grafana on the Ubuntu server, you’ll need to edit the grafana.ini file to add the Azure Database for MySQL parameters. As per the Grafana documentation on the Database settings, we will focus on the database parameters noted in the documentation. Please note: The username must be in the format user@server due to the server identification method of Azure Database for MySQL. Other formats will cause connections to fail.
- Azure Database for MySQL supports SSL connections. For enterprise production deployments, it is recommended to always enforce SSL. Additional information around setting up SSL with Azure Database for MySQL can be found in the Azure Database for MySQL documentation. Most modern installations of Ubuntu will have the necessary Baltimore Cyber Trust CA certificate already installed in your /etc/ssl/certs location. If needed, you can download the SSL Certificate CA used for Azure Database for MySQL from this location. The SSL mode can be provided in two forms, skip-verify and true. With skip-verify we will not validate the certificate provided but the connection is still encrypted. With true we are going to ensure that the certificate provided is validated by the Baltimore CA. This is useful for preventing “man in the middle” attacks. Note that in both situations, Grafana expects the certificate authority (CA) path to be provided.
- Next, you have the option to store the sessions of users in the Azure DB for MySQL in the table session. This is configured in the same grafana.ini under the session section. This is beneficial for instance in situations where you have load balanced environments to maintain sessions for users accessing Grafana. In the provider_config parameter, we need to include the user@server, password, full server and the TLS/SSL method. In this manner, this can be true or ssl-verify. Note that this is the go-sql-driver/mysql driver where more documentation is available.
- After this is all set, you should be able to start Grafana and verify the status with the commands below:
- systemctl start grafana-server
- systemctl status grafana-server
If you see any errors or issues, the default path for logging is /var/log/grafana/ where you can confirm what is preventing the startup. The following is a sample error where the username was not provided as user@server but rather just user.
lvl=eror msg=”Server shutdown” logger=server reason=”Service init failed: Migration failed err: Error 9999: An internal error has occurred. Please retry or report your issues.
Otherwise you should see the service in an Ok status and the initial startup will build all the necessary tables in the Azure DB for MySQL database.
Key takeaways
- The single VM setup for Grafana is great for quick start, testing and a proof of concept study but it may not be suitable for production deployments.
- For enterprise production deployments of Grafana, separating the configuration database to the dedicated server enables high availability and scalability.
- The Bitnami Grafana Multi-Tier template provides production ready template leveraging the scale out design and security to provision Grafana with a few clicks with no extra cost.
- Using managed database services like Azure Database for MySQL for production deployments provides built-in high availability, scalability, and enterprise security for the database repository.
Additional resources
Get started with Bitnami Multi-Tier Solutions on Microsoft Azure
Monitor Azure services and applications using Grafana
Monitor your Azure services in Grafana
Setting up Grafana for high availability
Azure Database for MySQL documentation
Acknowledgments
Special thanks to Shau Phang, Diana Putnam, Anitah Cantele and Bitnami team for their contributions to the blog post.
