Announcements Apr 21 4 min read Introducing Azure Accelerate for Databases: Modernize your data for AI with experts and investments Azure Accelerate for Databases helps organizations modernize their databases and build AI-ready capabilities.
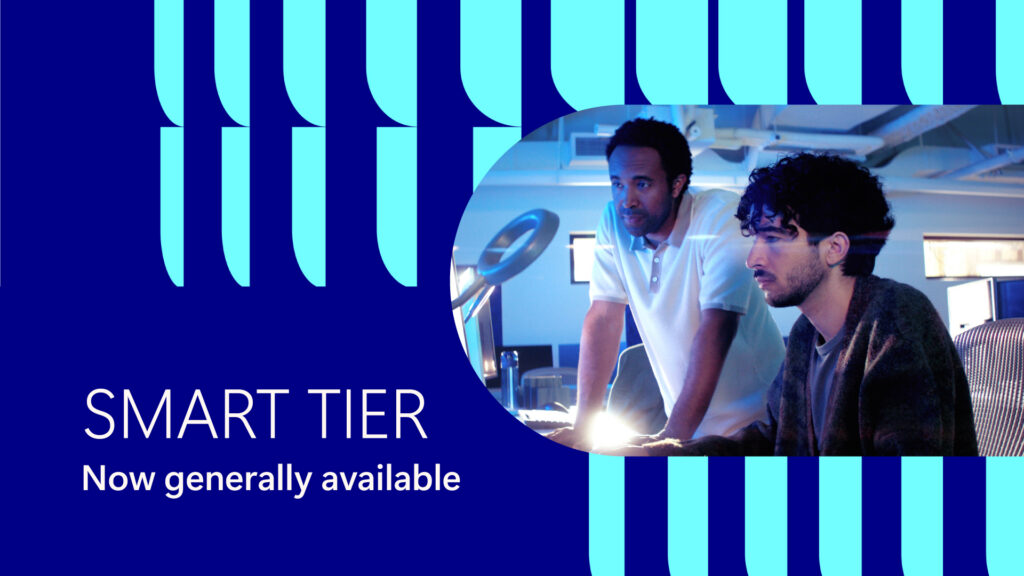
Announcements Apr 14 5 min read Optimize object storage costs automatically with smart tier—now generally available
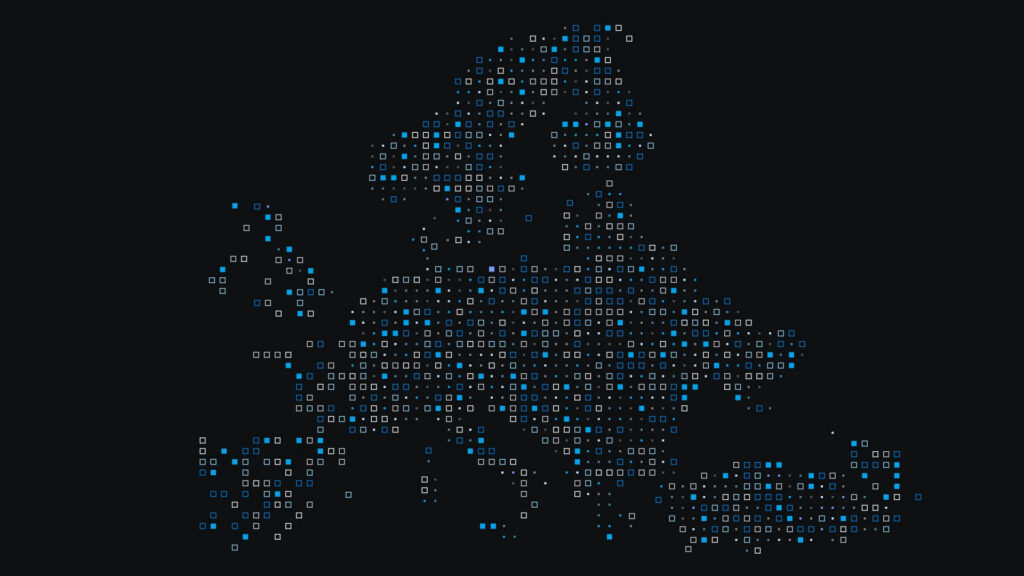
Thought leadership Mar 30 5 min read Navigating digital sovereignty at the frontier of transformation
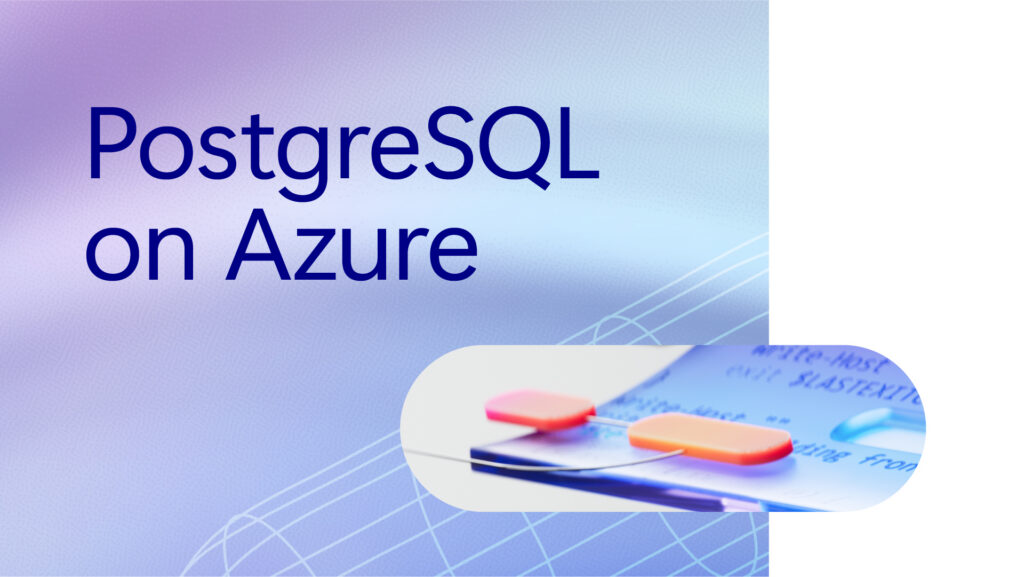
Thought leadership Mar 16 6 min read From legacy to leadership: How PostgreSQL on Azure powers enterprise agility and innovation
Thought leadership Apr 8 5 min read Cloud Cost Optimization: How to maximize ROI from AI, manage costs, and unlock real business value
Thought leadership Apr 1 6 min read Azure IaaS: Keep critical applications running with built-in resiliency at scale
Partnerships Mar 31 3 min read Building sovereign AI at the edge: Microsoft and Armada collaborate to deliver Azure Local on Galleon modular datacenters
Events Mar 24 6 min read What’s new with Microsoft in open-source and Kubernetes at KubeCon + CloudNativeCon Europe 2026
Announcements Mar 18 12 min read FabCon and SQLCon 2026: Unifying databases and Fabric on a single data platform
Announcements Nov 18, 2025 12 min read Microsoft Databases and Microsoft Fabric: Your unified and AI-powered data estate
Hybrid + multicloud Apr 9 3 min read Microsoft named a Leader in The Forrester Wave™ for Sovereign Cloud Platforms
AI + machine learning Apr 8 5 min read Cloud Cost Optimization: How to maximize ROI from AI, manage costs, and unlock real business value
Compute Apr 1 6 min read Azure IaaS: Keep critical applications running with built-in resiliency at scale
Hybrid + multicloud Mar 31 3 min read Building sovereign AI at the edge: Microsoft and Armada collaborate to deliver Azure Local on Galleon modular datacenters
Integration Mar 30 4 min read Microsoft named a Leader in 2026 Gartner® Magic Quadrant™ for Integration Platform as a Service
AI + machine learning Mar 25 5 min read AI for nuclear energy: Powering an intelligent, resilient future
Compute Mar 24 6 min read What’s new with Microsoft in open-source and Kubernetes at KubeCon + CloudNativeCon Europe 2026
Databases Mar 18 6 min read Advancing agentic AI with Microsoft databases across a unified data estate
AI + machine learning Mar 18 12 min read FabCon and SQLCon 2026: Unifying databases and Fabric on a single data platform
AI + machine learning Mar 16 4 min read Microsoft at NVIDIA GTC: New solutions for Microsoft Foundry, Azure AI infrastructure and Physical AI