|
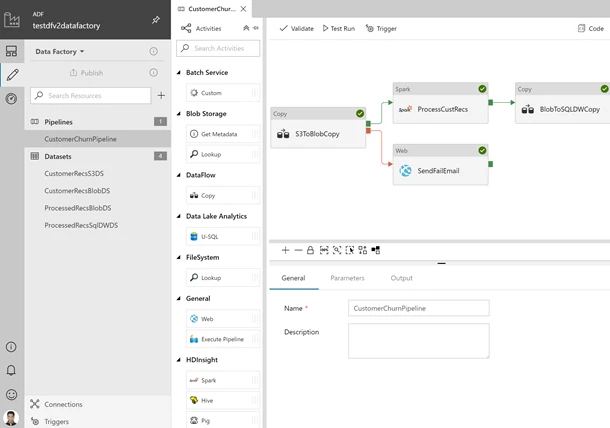
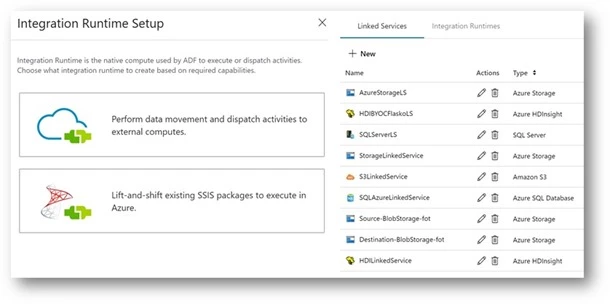
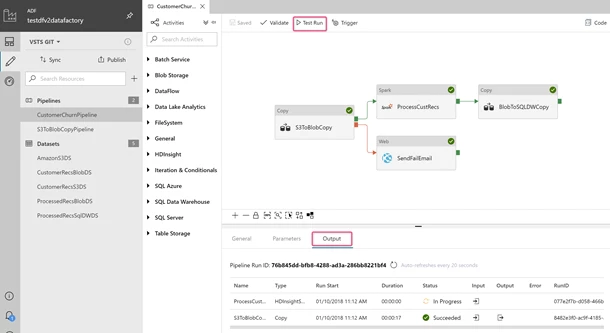
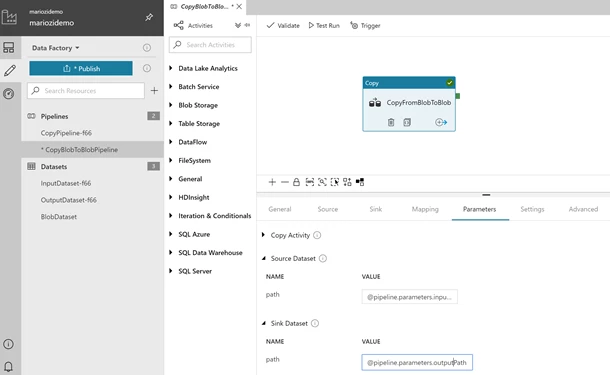
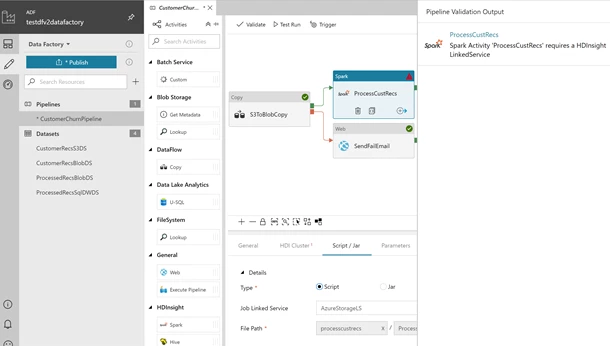
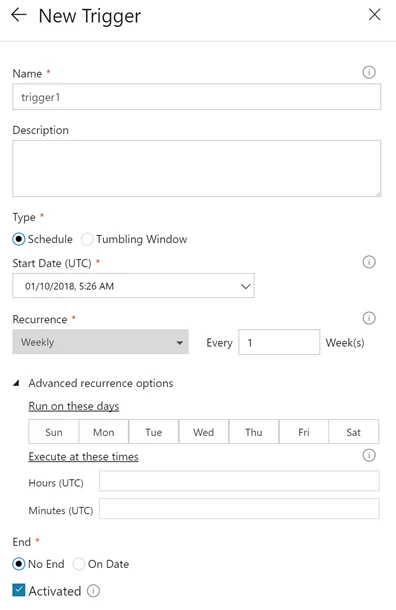
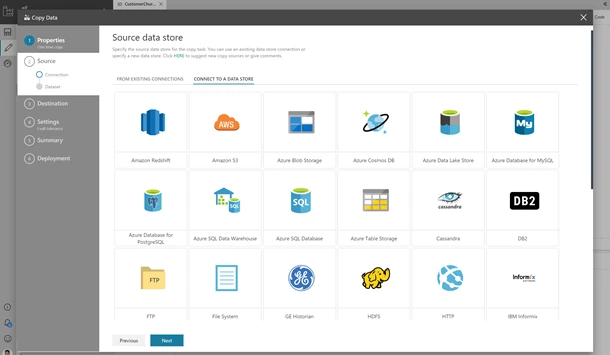
Azure Data Factory (ADF) v2 public preview was announced at Microsoft Ignite on Sep 25, 2017. With ADF v2, we added flexibility to ADF app model and enabled control flow constructs that now facilitates looping, branching, conditional constructs, on-demand executions and flexible scheduling in various programmatic interfaces like Python, .Net, Powershell, REST APIs, ARM templates. One of the consistent pieces of customer feedback we received, is to enable a rich interactive visual authoring and monitoring experience allowing users to create, configure, test, deploy and monitor data integration pipelines without any friction. We listened to your feedback and are happy to announce the release of visual tools for ADF v2. The main goal of the ADF visual tools is to allow you to be productive with ADF by getting pipelines up & running quickly without requiring to write a single line of code. You can use a simple and intuitive code free interface to drag and drop activities on a pipeline canvas, perform test runs, debug iteratively, deploy & monitor your pipeline runs. With this release, we are also providing guided tours on how to use the enabled visual authoring & monitoring features and also an ability to give us valuable feedback. |
Guided tour
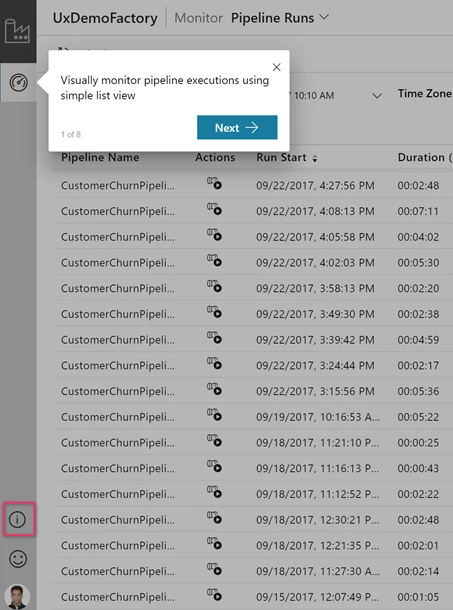
Click on the Information Icon in the lower left. You can then click Guided tour to get step by step instructions on how to visually monitor your pipeline and activity runs.
Feedback
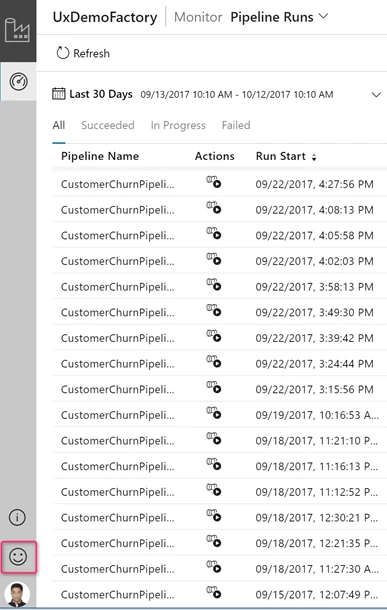
Click on the Feedback icon to give us feedback on various features or any issues that you may be facing.
Select data factory
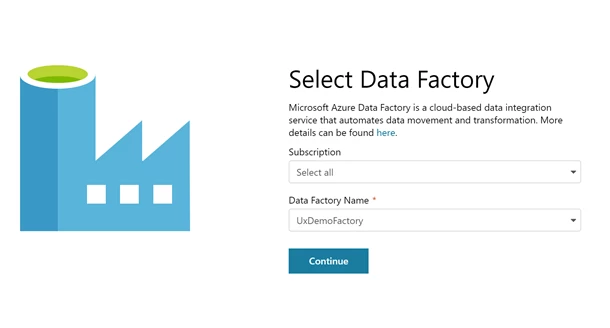
Hover on the Data Factory icon on the top left. Click on the Arrow icon to see a list of Azure subscriptions and data factories that you can monitor.
Visual Monitoring
List View Monitoring
Monitor pipeline, activity & trigger runs with a simple list view interface. All the runs are displayed in local browser time zone. You can change the time zone and all the date time fields will snap to the selected time zone.
Monitor Pipeline Runs:
List view showcasing each pipeline run for your data factory v2 pipelines.

Monitor Activity Runs:
List view showcasing activity runs corresponding to each pipeline run. Click Activity Runs icon under the Actions column to view activity runs for each pipeline run.
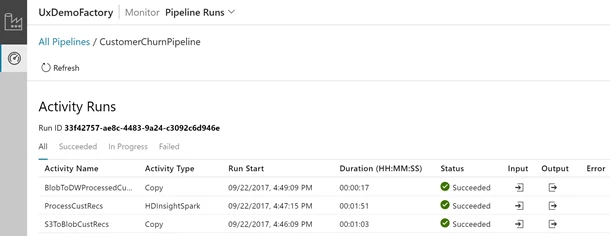
Important note: You need to click the Refresh icon on top to refresh the list of pipeline and activity runs. Auto-refresh is currently not supported.
Monitor Trigger Runs:

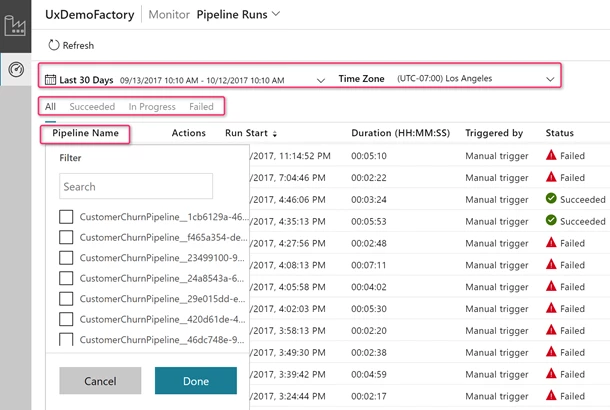
Rich ordering and filtering
Order pipeline runs in desc/asc by Run Start and filter pipeline runs pipeline name, run start and run status.
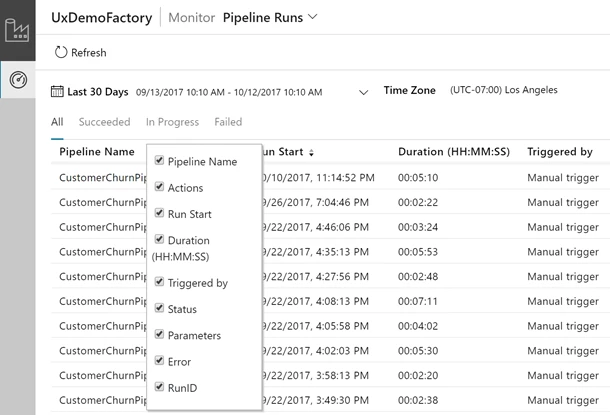
Add/Remove columns to list view
Right click the list view header and choose columns that you want to appear in the list view.
Reorder columns widths in list view
Increase and decrease the column widths in list view by simply hovering over the column header.
Monitor Integration Runtimes
Monitor health of your Self Hosted, Azure, Azure-SSIS Integration runtimes.

Cancel/Re-run your pipeline runs
Cancel a pipeline run or re-run a pipeline run with already defined parameters.
![clip_image001[1] clip_image001[1]](https://azure.microsoft.com/en-us/blog/wp-content/uploads/2018/01/4b0c74d3-b0b9-4e78-9efb-dc112b506dc4.webp)
This is the first public release of ADF v2 visual tools We are continuously working to refresh the released bits with new features based on customer feedback. Get more information and detailed steps for using the ADF v2 visual tools.
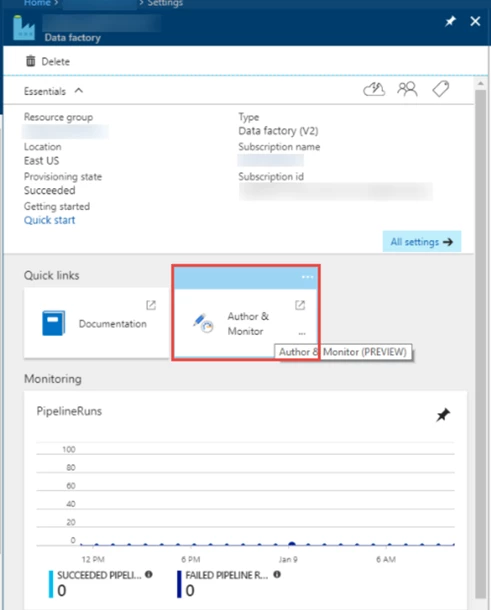
Get started building pipelines easily and quickly using Azure Data Factory. If you have any feature requests or want to provide feedback, please visit the Azure Data Factory forum.

![clip_image001[3] clip_image001[3]](https://azure.microsoft.com/en-us/blog/wp-content/uploads/2018/01/0210a500-91a8-4e9c-9de2-85b33c2dc596.webp)
