If you like getting up-close and personal with managing your computing resources, you’ll be happy to know that your Windows Azure Website comes with some useful online tools that let you do some really cool things with it. These tools are part of your site’s Kudu dashboard (also known as the SCM dashboard) and today we’ll see what these tools are.
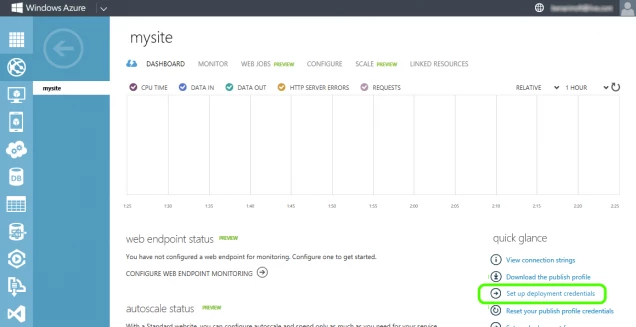
To get to the Kudu dashboard, simply browse using your favorite internet browser to https://{site name}.scm.azurewebsites.net (in other words, add .scm in front of the site name). Upon entry, you will be asked for credentials and those will be the same as your deployment credentials. If you have never set up your deployment credentials, you can open your site’s dashboard in the Azure Portal and click Set up deployment credentials. If you already have deployment credentials but do not remember them, you can use the dashboard to reset them as well:
Once you enter your credentials, you reach the Kudu dashboard of your site. Previously, this was only used for the Git deployment feature of WAWS, but now the dashboard contains several tools you can use to manage, monitor and debug your site.
NOTE: Kudu is actually an open-source project and you can see its sources on GitHub, including some more wikis and the opportunity to open issues regarding bugs or new features you want to see.
Kudu Dashboard Home
On the dashboard home, you can see the current build version (of kudu) and at the top you’ll see links to the different tool pages. Under REST API you’ll get links to the REST APIs that Kudu exposes:
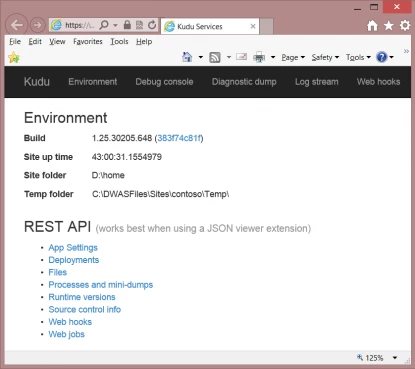
NOTE: Since the return value for the REST APIs is in json, you can use add-on tools such as JSONView for Chrome, which lets you browse through the APIs easily
Environment
The environment page can help you see what your website “sees” in terms of the current environment it’s running on. This includes general system information, app settings, environment variables, path, http headers and server variables:
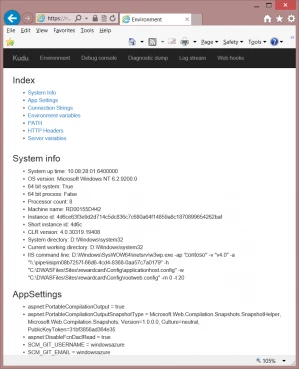
NOTE: While there is a connections strings section, it may not be exactly what your site sees as connection strings.
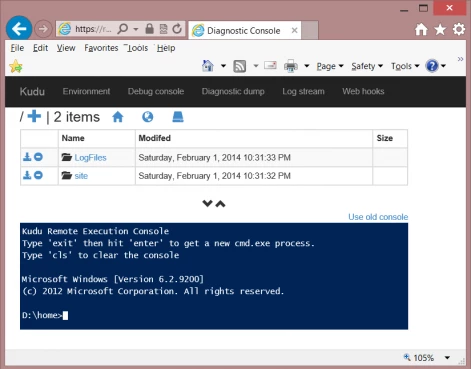
Debug Console
This is the crème of the crop in terms of usefulness for your Azure website. The debug console page actually contains 2 useful tools:
- File explorer for your site, where you can view your site’s content, download files (or full folders), delete files (or folders), edit files and even upload files using drag and drop. When you download a folder via the file explorer, it’s delivered to you as a ZIP file containing the entire folder structure.
- Remote terminal to your site, which allows you to run commands that will run on your site in a cmd.exe process. For example, you can run command ranging from a simple ones like dir or cd to advanced ones like Git clean and npm/nuget install. The terminal allows you to get a better understanding of the limitations of the sandbox (inside which your website is running). Note that the “current directory” is synced between the file explorer and the terminal for ease of use.
For additional information about the debug terminal, and other Kudu related info, visit my blog.
Diagnostics dump
The diagnostic dump is a link that will generate a ZIP file containing some of your site’s logs, which can help investigate issues. In fact, Microsoft support might even request you to generate such a dump when looking into issues related to deployment options such as Git and Dropbox.
Log stream
Clicking on the Log stream link will seem like it didn’t do anything, but in fact it starts a listener on your LogFiles directory, so any logs written there will show up. Naturally, if your site is completely idle, nothing would happen, but if it is active, log lines will start showing up once the log buffer fills up:
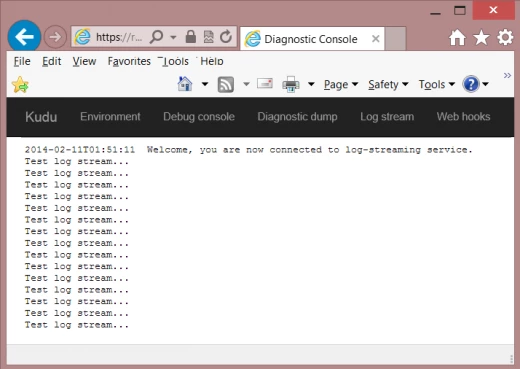
NOTE: Clicking this link will also enable your application logs persistence to the file system (in Error mode) for a period of 12 hours. This can be turned off from the Azure portal.
Web Hooks
Web hooks are a Pub/Sub mechanism where you can publish an event and all subscribers to that event will get it. Currently only one type of event is supported, and this is the Post Deployment event. Post Deployment is invoked by Kudu whenever a Git (or Dropbox/Mercurial) deployment is performed (whether it was successful or failed):
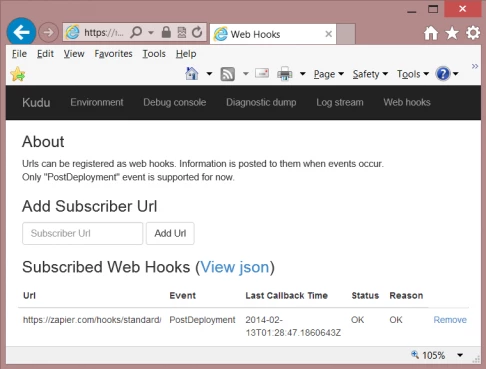
We currently use this capability by integrating with a service called Zapier, which allows a user to subscribe to this event and in response invoke many types of actions (for example, send an email, call a phone number, send a tweet and more). More information can be found in this post.
In closing, the Kudu dashboard is one of the most powerful and versatile extensions to Azure Web Sites, and give you a lot of control over your site. We hope you take advantage of these on your way to a productive and successful deployment!