Skip to main content Explore View all products (200+) Microsoft Foundry Azure Copilot GitHub Copilot Azure Kubernetes Service (AKS) Azure Cosmos DB Azure Database for PostgreSQL Azure Arc Microsoft Fabric Linux virtual machines in Azure Foundry Models Foundry Agent Service Foundry IQ Foundry Tools Foundry Control Plane Observability in Foundry Control Plane Azure OpenAI in Foundry Models Azure Speech in Foundry Tools Azure Machine Learning View all databases Azure Cosmos DB Azure DocumentDB Azure SQL Azure Database for PostgreSQL Azure Managed Redis Microsoft Fabric Azure Databricks Linux virtual machines in Azure Windows Server on Azure Azure Functions Azure Virtual Machine Scale Sets Azure API Management Azure Container Apps Azure Kubernetes Service (AKS) Azure Kubernetes Fleet Manager Azure Container Registry Azure Red Hat OpenShift Azure Container Instances Azure Container Storage Azure Arc Azure Local Microsoft Defender for Cloud Azure Monitor Microsoft Sentinel Azure Migrate View all solutions (40+) Cloud solutions for small and medium businesses Cloud migration and modernization center Data analytics for AI Azure Databases AI apps and agents Microsoft Marketplace Microsoft Sovereign Cloud AI apps and agents Responsible AI with Azure AI Infrastructure Data analytics for AI Machine learning operations (MLOps) Low-code application development on Azure Integration Services Serverless computing DevOps Migration and modernization center .NET apps migration Databases on Azure Linux on Azure Oracle on Azure SAP on the Microsoft Cloud Adaptive cloud High-performance computing (HPC) Infrastructure as a service (IaaS) Resiliency Azure Essentials Frontier Accelerate for Azure FinOps on Azure Microsoft Marketplace Azure pricing overview Create an Azure account Free Azure services Flexible purchase options Pricing calculator FinOps on Azure Maximize ROI from AI Azure savings plans Azure reservations Azure Hybrid Benefit Virtual Machines Azure SQL Microsoft Foundry Microsoft Fabric Azure Kubernetes Service (AKS) Microsoft Defender for Cloud View more Software Development Companies Microsoft Marketplace Find a partner Resources for Azure partners Get started with Azure Customer stories Analyst reports, white papers, and e-books Videos Learn more about cloud computing Documentation Explore Azure portal Developer resources Quickstart templates Resources for startups Developer community Students Azure for partners Blog Events and Webinars Learn Support Contact Sales Get started with Azure Sign in

Are you using Azure Data Explorer to query vast amounts of data? Are you following business metrics and KPIs with Grafana dashboards? Creating a Grafana data source with Azure Data Explorer has never been easier.

Grafana is a leading open source software designed for visualizing time series analytics. It is an analytics and metrics platform that enables you to query and visualize data and create and share dashboards based on those visualizations. Combining Grafana’s beautiful visualizations with Azure Data Explorer’s snappy ad hoc queries over massive amounts of data, creates impressive usage potential.

The Grafana and Azure Data Explorer teams have created a dedicated plugin which enables you to connect to and visualize data from Azure Data Explorer using its intuitive and powerful Kusto Query Language. In just a few minutes, you can unlock the potential of your data and create your first Grafana dashboard with Azure Data Explorer.

Once you build an Azure Data Explorer data source in Grafana, you can create a dashboard panel and select Edit to add your query.
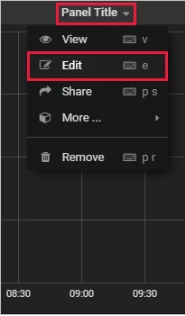
Creating a Grafana dashboard panel screenshot

Kusto Query Language is available for executing queries in the Metrics tab. The built-in intellisense which proposes query term completion, assists in query formulation. You run the query to visualize the data.

GithubEvent
| where Repo.name has 'Microsoft'
| summarize TotalEvents = count() by bin(CreatedAt,30d)
|order by CreatedAt asc

Running GitHub event code screenshot
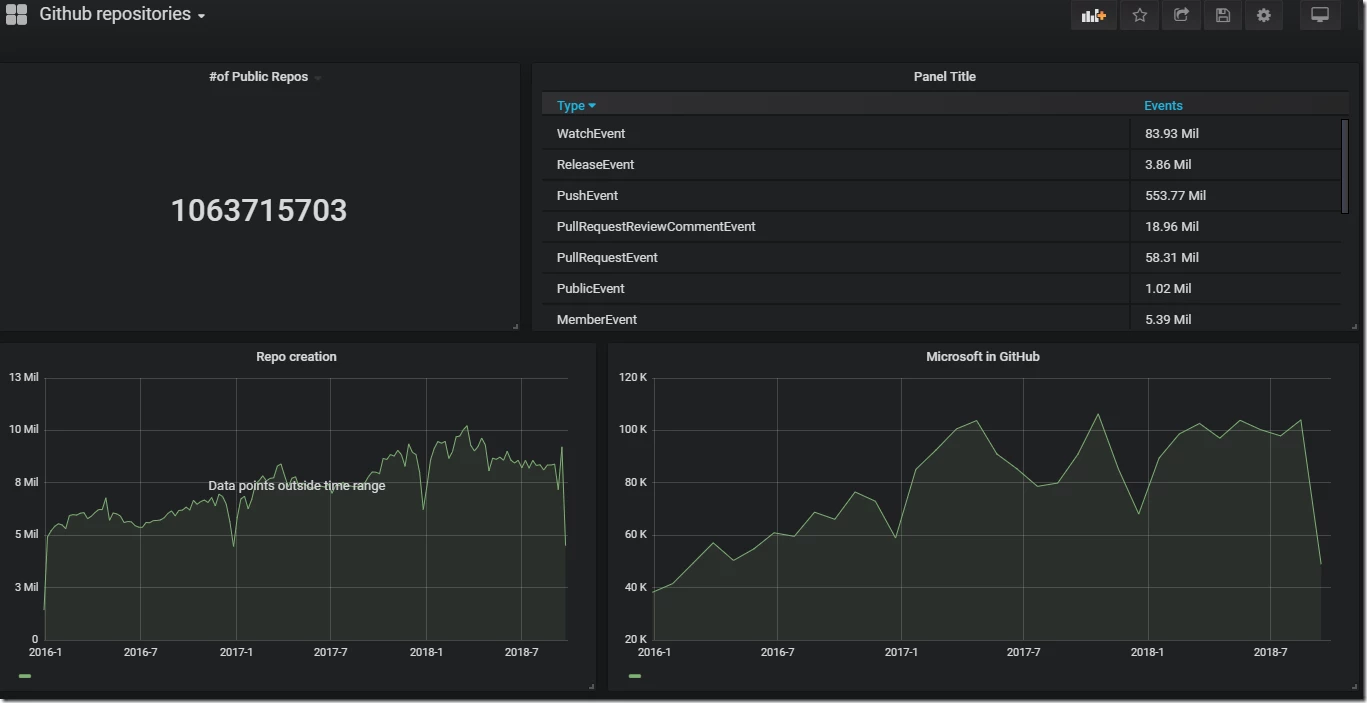
Final version of sample Grafana dashboard panel screenshot

For more details on visualizing data from Azure Data Explorer in Grafana please visit our documentation, “Visualize data from Azure Data Explorer in Grafana.” It depicts the step-by-step process needed to set up Azure Data Explorer as a data source for Grafana, and then visualizes data from a sample cluster.

Next steps

In this blog, we depict the benefits of using Grafana for building dashboards on top of your Azure Data Explorer datasets. Additional connectors and plugins to analytics tools and services will be added in the weeks to come. Stay tuned for more updates.

To find out more about Azure Data Explorer you can:

WE ARE MICROSOFT

Explore Microsoft Foundry

The future of AI starts here. Envision your next great AI app with the latest technologies. Get started with Azure.