

FabCon and SQLCon 2026: Unifying databases and Fabric on a single data platform
We’re bring attendees together to share real experiences and solve challenges side-by-side. Only together can we move into meaningful results.
We’re bring attendees together to share real experiences and solve challenges side-by-side. Only together can we move into meaningful results.
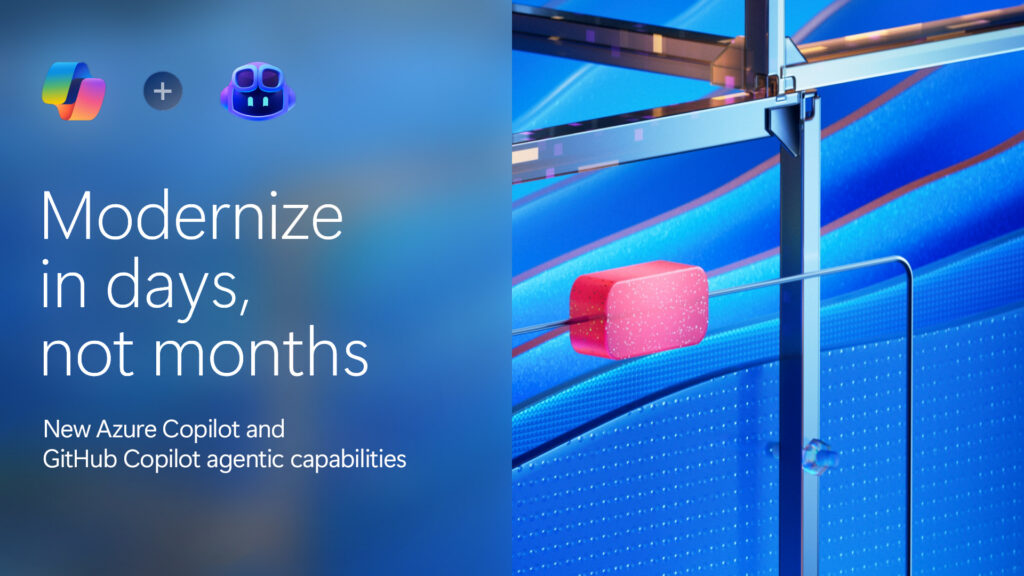
We’re announcing the first agentic end-to-end modernization solution that brings IT and developers into a single, connected workflow.
From GitHub Copilot AI assistance to built-in model management, Azure is helping devs and enterprises unlock the full potential of PostgreSQL.
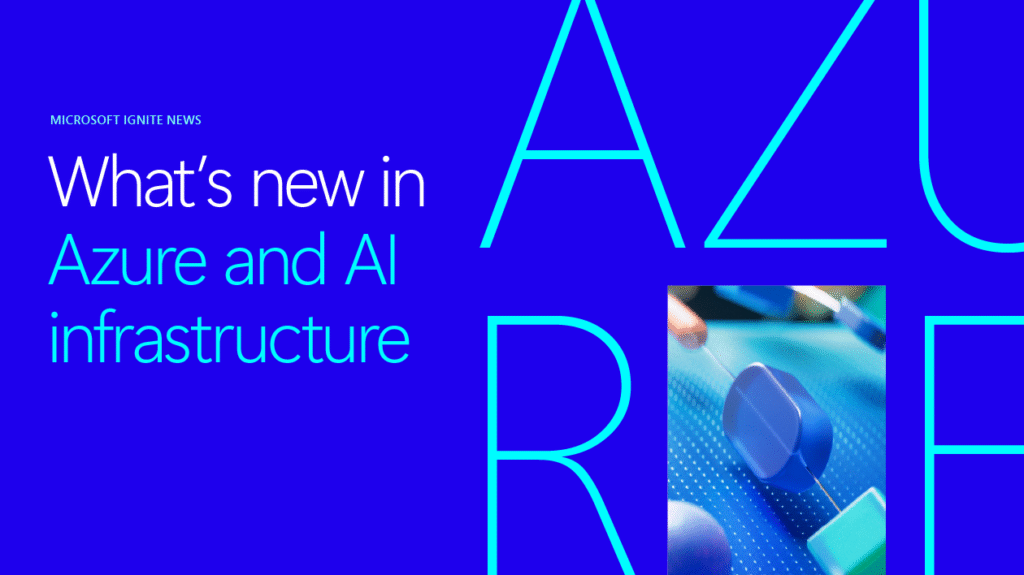
Learn about the new AI features and products In Azure announced at Microsoft Ignite 2025 to help modernize your cloud infrastructure.
Empowering organizations to shape the future of cloud with resilient, always-on solutions.
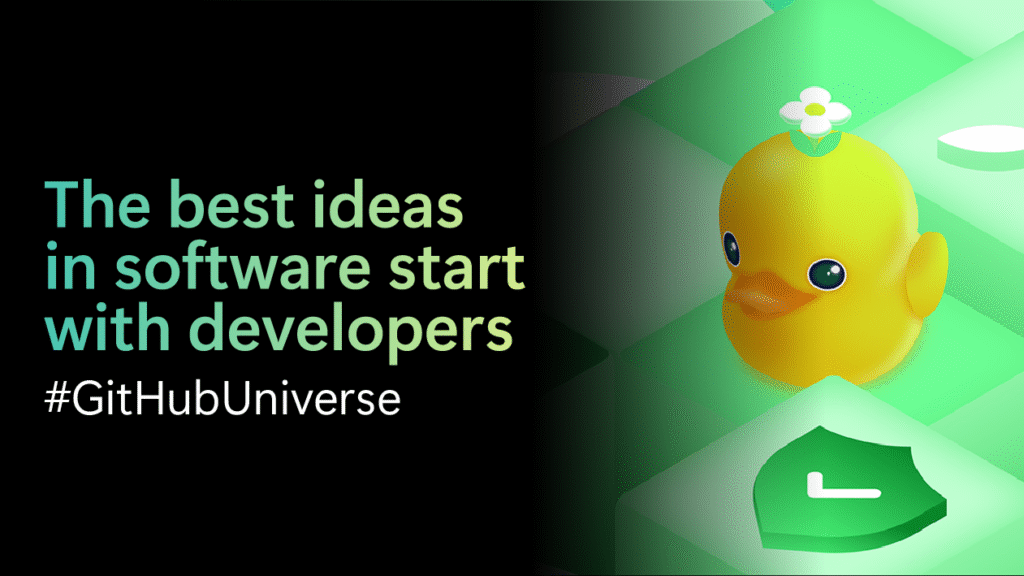
At GitHub Universe 2025, the theme was clear: the ability to see, steer, and build across agents will bring the greatest impact.
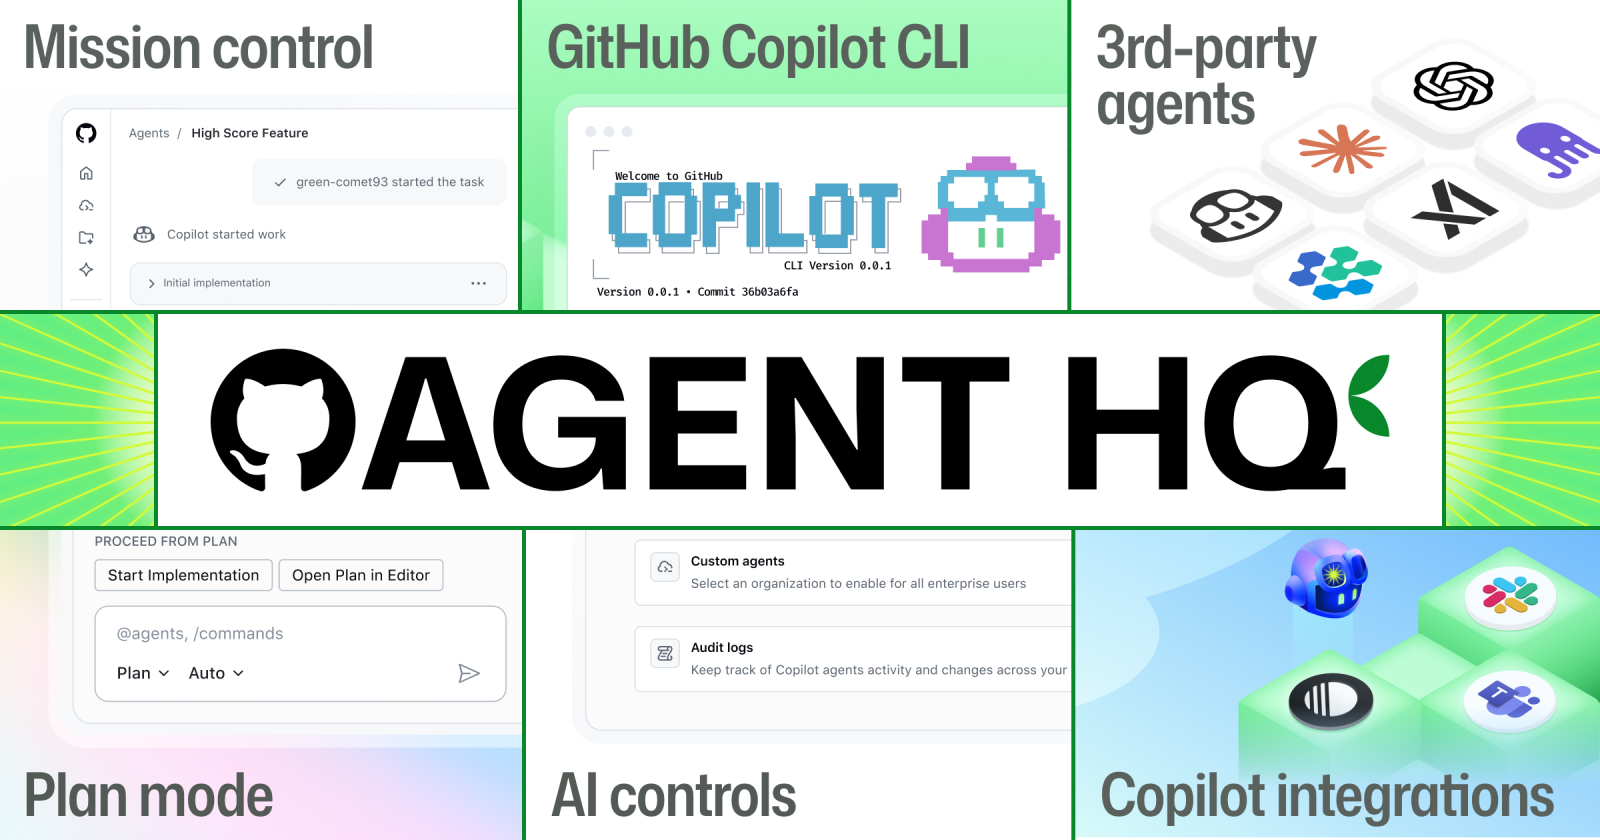
At Universe 2025, GitHub’s next evolution introduces a single, unified workflow for developers to be able to orchestrate any agent, any time, anywhere.

Autonomous workflows, powered by real-time feedback and continuous learning, are becoming essential for productivity and decision-making.

Microsoft is expanding its cloud infrastructure across Asia to help organizations scale with secure, AI-ready services. Learn more.
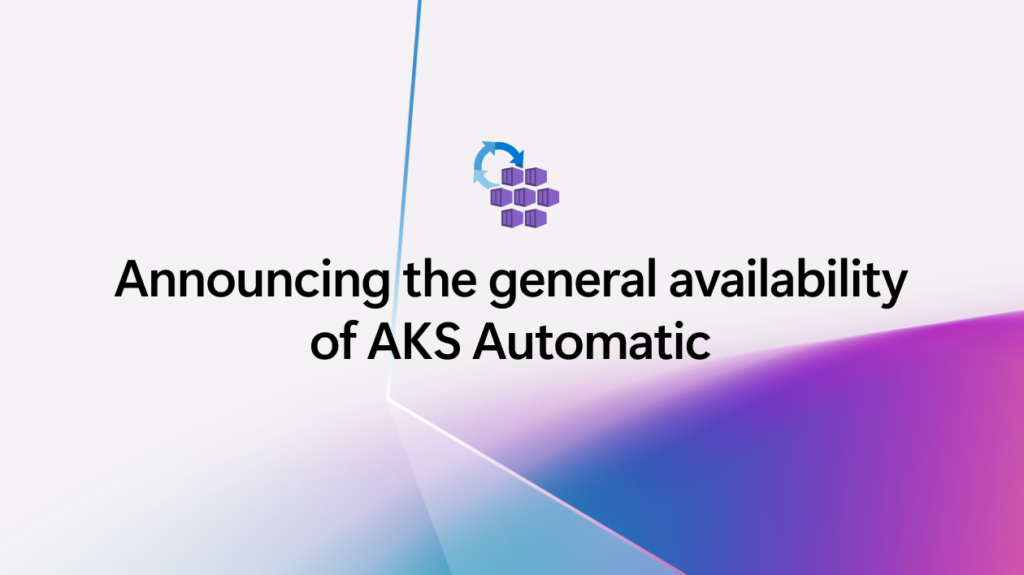
Azure Kubernetes Service Automatic helps teams go from commit to cloud without friction, accelerating delivery and unleashing innovation.
It’s no longer whether you can build an agent—it’s how fast and seamlessly you can go from idea to enterprise-ready deployment.

Instead of simply delivering information, agents reason, act, and collaborate—bridging the gap between knowledge and outcomes. Read more about agentic AI in Azure AI Foundry.