Introduction
As a follow-up to my March 1 posting, I want to share the findings of our root cause analysis of the service disruption of February 29th. We know that many of our customers were impacted by this event and we want to be transparent about what happened, what issues we found, how we plan to address these issues, and how we are learning from the incident to prevent a similar occurrence in the future.
Again, we sincerely apologize for the disruption, downtime and inconvenience this incident has caused. We will be proactively issuing a service credit to our impacted customers as explained below. Rest assured that we are already hard at work using our learnings to improve Windows Azure.
Overview of Windows Azure and the Service Disruption
Windows Azure comprises many different services, including Compute, Storage, Networking and higher-level services like Service Bus and SQL Azure. This partial service outage impacted Windows Azure Compute and dependent services: Access Control Service (ACS), Windows Azure Service Bus, SQL Azure Portal, and Data Sync Services. It did not impact Windows Azure Storage or SQL Azure.
While the trigger for this incident was a specific software bug, Windows Azure consists of many components and there were other interactions with normal operations that complicated this disruption. There were two phases to this incident. The first phase was focused on the detection, response and fix of the initial software bug. The second phase was focused on the handful of clusters that were impacted due to unanticipated interactions with our normal servicing operations that were underway. Understanding the technical details of the issue requires some background on the functioning of some of the low-level Windows Azure components.
Fabric Controllers, Agents and Certificates
In Windows Azure, cloud applications consist of virtual machines running on physical servers in Microsoft datacenters. Servers are grouped into “clusters” of about 1000 that are each independently managed by a scaled-out and redundant platform software component called the Fabric Controller (FC), as depicted in Figure 1. Each FC manages the lifecycle of applications running in its cluster, provisions and monitors the health of the hardware under its control. It executes both autonomic operations, like reincarnating virtual machine instances on healthy servers when it determines that a server has failed, as well as application-management operations like deploying, updating and scaling out applications. Dividing the datacenter into clusters isolates faults at the FC level, preventing certain classes of errors from affecting servers beyond the cluster in which they occur.
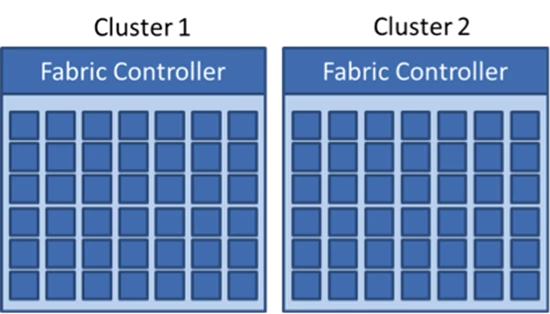
Figure 1. Clusters and Fabric Controllers
Part of Windows Azure’s Platform as a Service (PaaS) functionality requires its tight integration with applications that run in VMs through the use of a “guest agent” (GA) that it deploys into the OS image used by the VMs, shown in Figure 2. Each server has a “host agent” (HA) that the FC leverages to deploy application secrets, like SSL certificates that an application includes in its package for securing HTTPS endpoints, as well as to “heart beat” with the GA to determine whether the VM is healthy or if the FC should take recovery actions.
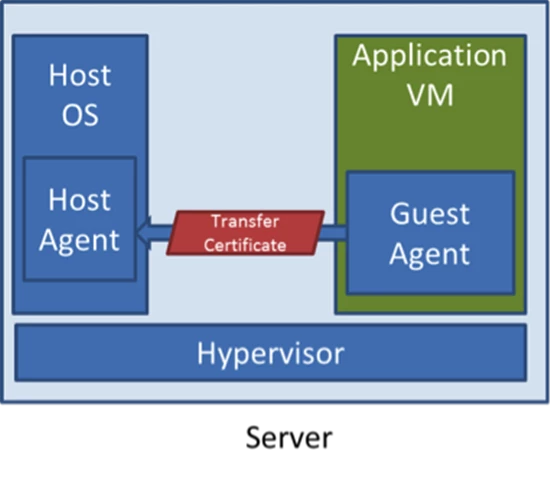
Figure 2. Host Agent and Guest Agent Initialization
So that the application secrets, like certificates, are always encrypted when transmitted over the physical or logical networks, the GA creates a “transfer certificate” when it initializes. The first step the GA takes during the setup of its connection with the HA is to pass the HA the public key version of the transfer certificate. The HA can then encrypt secrets and because only the GA has the private key, only the GA in the target VM can decrypt those secrets.
There are several cases that require generation of a new transfer certificate. Most of the time that’s only when a new VM is created, which occurs when a user launches a new deployment, when a deployment scales out, or when a deployment updates its VM operating system. The fourth case is when the FC reincarnates a VM that was running on a server it has deemed unhealthy to a different server, a process the platform calls “service healing.”
The Leap Day Bug
When the GA creates the transfer certificate, it gives it a one year validity range. It uses midnight UST of the current day as the valid-from date and one year from that date as the valid-to date. The leap day bug is that the GA calculated the valid-to date by simply taking the current date and adding one to its year. That meant that any GA that tried to create a transfer certificate on leap day set a valid-to date of February 29, 2013, an invalid date that caused the certificate creation to fail.
As mentioned, transfer certificate creation is the first step of the GA initialization and is required before it will connect to the HA. When a GA fails to create its certificates, it terminates. The HA has a 25-minute timeout for hearing from the GA. When a GA doesn’t connect within that timeout, the HA reinitializes the VM’s OS and restarts it.
If a clean VM (one in which no customer code has executed) times out its GA connection three times in a row, the HA decides that a hardware problem must be the cause since the GA would otherwise have reported an error. The HA then reports to the FC that the server is faulty and the FC moves it to a state called Human Investigate (HI). As part of its standard autonomic failure recovery operations for a server in the HI state, the FC will service heal any VMs that were assigned to the failed server by reincarnating them to other servers. In a case like this, when the VMs are moved to available servers the leap day bug will reproduce during GA initialization, resulting in a cascade of servers that move to HI.
To prevent a cascading software bug from causing the outage of an entire cluster, the FC has an HI threshold, that when hit, essentially moves the whole cluster to a similar HI state. At that point the FC stops all internally initiated software updates and automatic service healing is disabled. This state, while degraded, gives operators the opportunity to take control and repair the problem before it progresses further.
The Leap Day Bug in Action
The leap day bug immediately triggered at 4:00PM PST, February 28th (00:00 UST February 29th) when GAs in new VMs tried to generate certificates. Storage clusters were not affected because they don’t run with a GA, but normal application deployment, scale-out and service healing would have resulted in new VM creation. At the same time many clusters were also in the midst of the rollout of a new version of the FC, HA and GA. That ensured that the bug would be hit immediately in those clusters and the server HI threshold hit precisely 75 minutes (3 times 25 minute timeout) later at 5:15PM PST. The bug worked its way more slowly through clusters that were not being updated, but the critical alarms on the updating clusters automatically stopped the updates and alerted operations staff to the problem. They in turn notified on-call FC developers, who researched the cause and at 6:38PM PST our developers identified the bug.
By this time some applications had single VMs offline and some also had multiple VMs offline, but most applications with multiple VMs maintained availability, albeit with some reduced capacity. To prevent customers from inadvertently causing further impact to their running applications, unsuccessfully scaling-out their applications, and fruitlessly trying to deploy new applications, we disabled service management functionality in all clusters worldwide at 6:55PM PST. This is the first time we’ve ever taken this step. Service management allows customers to deploy, update, stop and scale their applications but isn’t necessary for the continued operation of already deployed applications. However stopping service management prevents customers from modifying or updating their currently deployed applications.
We created a test and rollout plan for the updated GA by approximately 10:00PM PST, had the updated GA code ready at 11:20PM PST, and finished testing it in a test cluster at 1:50AM PST, February 29th. In parallel, we successfully tested the fix in production clusters on the VMs of several of our own applications. We next initiated rollout of the GA to one production cluster and that completed successfully at 2:11AM PST, at which time we pushed the fix to all clusters. As clusters were updated we restored service management functionality for them and at 5:23AM PST we announced service management had been restored to the majority of our clusters.
Secondary Outage
When service management was disabled, most of the clusters either were already running the latest FC, GA and HA versions or almost done with their rollouts. Those clusters were completely repaired. Seven clusters, however, had just started their rollouts when the bug affected them. Most servers had the old HA/GA combination and some had the new combination, both of which contained the GA leap day bug, as shown below:
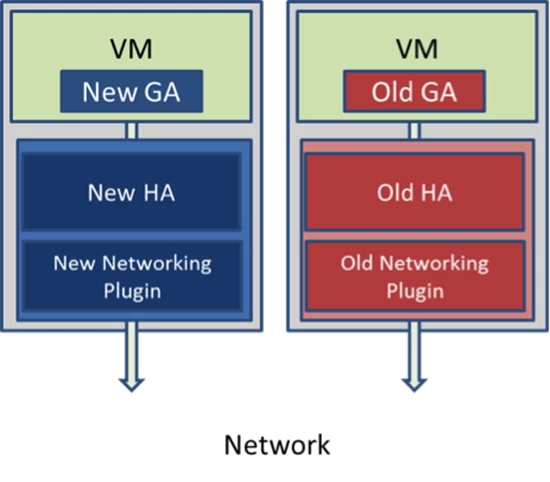
Figure 3. Servers running different versions of the HA and GA
We took a different approach to repair these seven clusters, which were in a partially updated state. We restored to previous versions of the FC, HA, but with a fixed GA, instead of updating them to the new HA with a fixed new GA. The first step we took was to test the solution by putting the older HA on a server that had previously been updated to the new HA to keep version compatibility with the older GA. The VMs on the server started successfully and appeared to be healthy.
Under normal circumstances when we apply HA and GA updates to a cluster, the update takes many hours because we honor deployment availability constraints called Update Domains (UDs). Instead of pushing the older HA out using the standard deployment functionality, we felt confident enough with the tests to opt for a “blast” update, which simultaneously updated to the older version the HA on all servers at the same time.
Unfortunately, in our eagerness to get the fix deployed, we had overlooked the fact that the update package we created with the older HA included the networking plugin that was written for the newer HA, and the two were incompatible. The networking plugin is responsible for configuring a VM’s virtual network and without its functionality a VM has no networking capability. Our test of the single server had not included testing network connectivity to the VMs on the server, which was not working. Figure 4 depicts the incompatible combination.
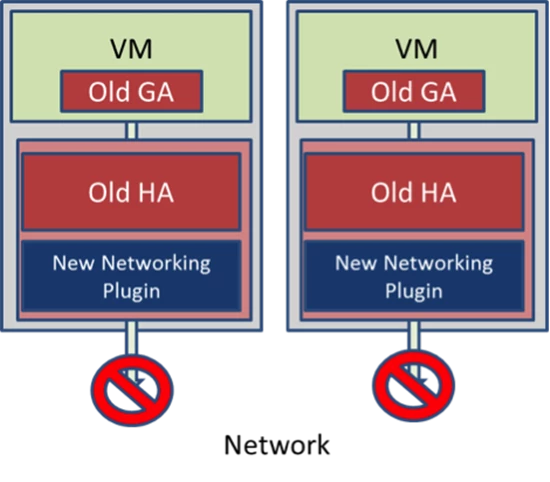
Figure 4. Servers running the incompatible combination of HA and HA networking plugin
At 2:47 AM PST on the 29th, we pushed the incompatible combination of components to those seven clusters and every VM, including ones that had been healthy previously, causing them to become disconnected from the network. Since major services such as Access Control Service (ACS) and Windows Azure Service Bus deployments were in those clusters, any application using them was now impacted because of the loss of services on which they depended.
We quickly produced a corrected HA package and at 3:40 AM PST tested again, this time verifying VM connectivity and other aspects of VM health. Given the impact on these seven clusters, we chose to blast out the fix starting at 5:40 AM PST. The clusters were largely operational again by 8:00 AM PST, but a number of servers were in corrupted states as a result of the various transitions. Developers and operations staff worked furiously through the rest of the day manually restoring and validating these servers. As clusters and services were brought back online we provided updates to the dashboard, and posted the last incident update to the Windows Azure dashboard that all Windows Azure services were healthy at 2:15 AM PST, March 1st.
Improving the Service
After an incident occurs, we take the time to analyze the incident and ways we can improve our engineering, operations and communications. To learn as much as we can, we do the root cause analysis but also follow this up with an analysis of all aspects of the incident. The three truths of cloud computing are: hardware fails, software has bugs and people make mistakes. Our job is to mitigate all of these unpredictable issues to provide a robust service for our customers. By understanding and addressing these issues we will continue to improve the service we offer to our customers.
The analysis is organized into four major areas, looking at each part of the incident lifecycle as well as the engineering process that preceded it:
- Prevention – how the system can avoid, isolate, and/or recover from failures
- Detection – how to rapidly surface failures and prioritize recovery
- Response – how to support our customers during an incident
- Recovery – how to reduce the recovery time and impact on our customers
Prevention
- Testing. The root cause of the initial outage was a software bug due to the incorrect manipulation of date/time values. We are taking steps that improve our testing to detect time-related bugs. We are also enhancing our code analysis tools to detect this and similar classes of coding issues, and we have already reviewed our code base.
- Fault Isolation. The Fabric Controller moved nodes to a Human Investigate (HI) state when their operations failed due to the Guest Agent (GA) bug. It incorrectly assumed the hardware, not the GA, was faulty. We are taking steps to distinguish these faults and isolate them before they can propagate further into the system.
- Graceful Degradation. We took the step of turning off service management to protect customers’ already running services during this incident, but this also prevented any ongoing management of their services. We are taking steps to have finer granularity controls to allow disabling different aspects of the service while keeping others up and visible.
Detection
- Fail Fast. GA failures were not surfaced until 75 minutes after a long timeout. We are taking steps to better classify errors so that we fail-fast in these cases, alert these failures and start recovery.
Response
- Service Dashboard. The Windows Azure Dashboard is the primary mechanism to communicate individual service health to customers. However the service dashboard experienced intermittent availability issues, didn’t provide a summary of the situation in its entirety, and didn’t provide the granularity of detail and transparency our customers need and expect.
- Intermittent availability: This dashboard is run on two different internal infrastructures, Windows Azure and Microsoft.com, to deal with the catastrophic failure of either system. It is also geo-replicated to deal with geographic specific incidents. However, the dashboard experienced intermittent availability issues due to exceptionally high volume and fail-over/load balancing that was taking place. We have taken steps to correct this and ensure more robust service in the future.
- Situation summary: The service dashboard provides information on the health status of 60+ individual services at the sub-region level. While this is valuable in understanding individual service status, the lack of summary information made it difficult for customers to understand the situation holistically. Customers have asked for a summarized view on the dashboard to quickly gain a comprehensive understanding of the scope and severity of the outage. We are taking steps to make this change.
- Detail and transparency: Although updates are posted on an hourly basis, the status updates were often generic or repeated the information provided in the last couple of hours. Customers have asked that we provide more details and new information on the specific work taking place to resolve the issue. We are committed to providing more detail and transparency on steps we’re taking to resolve an outage as well as details on progress and setbacks along the way.
- Customer Support. During this incident, we had exceptionally high call volumes that led to longer than expected wait times. While we are staffed to handle high call volumes in the event of an outage the intermittent availability of the service dashboard and lack of updates through other communication channels contributed to the increased call volume. We are reevaluating our customer support staffing needs and taking steps to provide more transparent communication through a broader set of channels.
- Other Communication Channels. A significant number of customers are asking us to better use our blog, Facebook page, and Twitter handle to communicate with them in the event of an incident. They are also asking that we provide official communication through email more quickly in the days following the incident. We are taking steps to improve our communication overall and to provide more proactive information through these vehicles. We are also taking steps to provide more granular tools to customers and support to diagnose problems with their specific services.
Recovery
- Internal tooling. We developed and modified some of our internal tooling to address this incident. We will continue to invest in our tools to help speed recovery and make recovery from intermediate states more predictable.
- Dependency priorities. We are also examining our processes to make sure dependencies are factored into recovery to ensure that all Windows Azure infrastructure services, such as ACS and Windows Azure Service Bus, are recovered first to reduce the impact on customers.
- Visibility. We are looking at how we can provide better visibility into recovery steps and provide customers with visibility into the intermediate progress being made.
Service Credits
Microsoft recognizes that this outage had a significant impact on many of our customers. We stand behind the quality of our service and our Service Level Agreement (SLA), and we remain committed to our customers. Due to the extraordinary nature of this event, we have decided to provide a 33% credit to all customers of Windows Azure Compute, Access Control, Service Bus and Caching for the entire affected billing month(s) for these services, regardless of whether their service was impacted. These credits will be applied proactively and will be reflected on a billing period subsequent to the affected billing period. Customers who have additional questions can contact support for more information.
Conclusion
We will continue to spend time to fully understand all of the issues outlined above and over the coming days and weeks we will take steps to address and mitigate the issues to improve our service. We know that our customers depend on Windows Azure for their services and we take our SLA with customers very seriously. We will strive to continue to be transparent with customers when incidents occur and will use the learning to advance our engineering, operations, communications and customer support and improve our service to you.
Sincerely,
Bill Laing and the Windows Azure Team