Previously, we shared an update on Project Flash as part of our Advancing Reliability blog series, reaffirming our commitment to helping Azure customers detect and diagnose virtual machine (VM) availability issues with speed and precision. This year, we’re excited to unveil the latest innovations that take VM availability monitoring to the next level—enabling customers to operate their workloads on Azure with even greater confidence. I’ve asked Yingqi (Halley) Ding, Technical Program Manager from the Azure Core Compute team, to walk us through the newest investments powering the next phase of Project Flash.
— Mark Russinovich, CTO, Deputy CISO, and Technical Fellow, Microsoft Azure.
Project Flash is a cross-division initiative at Microsoft. Its vision is to deliver precise telemetry, real-time alerts, and scalable monitoring—all within a unified, user-friendly experience designed to meet the diverse observability needs of virtual machine (VM) availability.
Flash addresses both platform-level and user-level challenges. It enables rapid detection of issues originating from the Azure platform, helping teams respond quickly to infrastructure-related disruptions. At the same time, it equips you with actionable insights to diagnose and resolve problems within your own environment. This dual capability supports high availability and helps ensure your business Service-Level Agreements are consistently met. It’s our mission to ensure you can:
- Gain clear visibility into disruptions, such as VM reboots and restarts, application freezes due to network driver updates, and 30-second host OS updates—with detailed insights into what happened, why it occurred, and whether it was planned or unexpected.
- Analyze trends and set alerts to speed up debugging and track availability over time.
- Monitor at scale and build custom dashboards to stay on top of the health of all resources.
- Receive automated root cause analyses (RCAs) that explain which VMs were affected, what caused the issue, how long it lasted, and what was done to fix it.
- Receive real-time notifications for critical events, such as degraded nodes requiring VM redeployment, platform-initiated service healing, or in-place reboots triggered by hardware issues—empowering your teams to respond swiftly and minimize user impact.
- Adapt recovery policies dynamically to meet changing workload needs and business priorities.
During our team’s journey with Flash, it has garnered widespread adoption from some of the world’s leading companies spanning from e-commerce, gaming, finance, hedge funds, and many other sectors. Their extensive utilization of Flash underscores its effectiveness and value in meeting the diverse needs of high-profile organizations.
At BlackRock, VM reliability is critical to our operations. If a VM is running on degraded hardware, we want to be alerted quickly so we have the maximum opportunity to mitigate the issue before it impacts users. With Project Flash, we receive a resource health event integrated into our alerting processes the moment an underlying node in Azure infrastructure is marked unallocatable, typically due to health degradation. Our infrastructure team then schedules a migration of the affected resource to healthy hardware at an optimal time. This ability to predictively avoid abrupt VM failures has reduced our VM interruption rate and improved the overall reliability of our investment platform.
— Eli Hamburger, Head of Infrastructure Hosting, BlackRock.
Suite of solutions available today
The Flash initiative has evolved into a robust, scalable monitoring framework designed to meet the diverse needs of modern infrastructure—whether you’re managing a handful of VMs or operating at massive scale. Built with reliability at its core, Flash empowers you to monitor what matters most, using the tools and telemetry that align with your architecture and operational model.
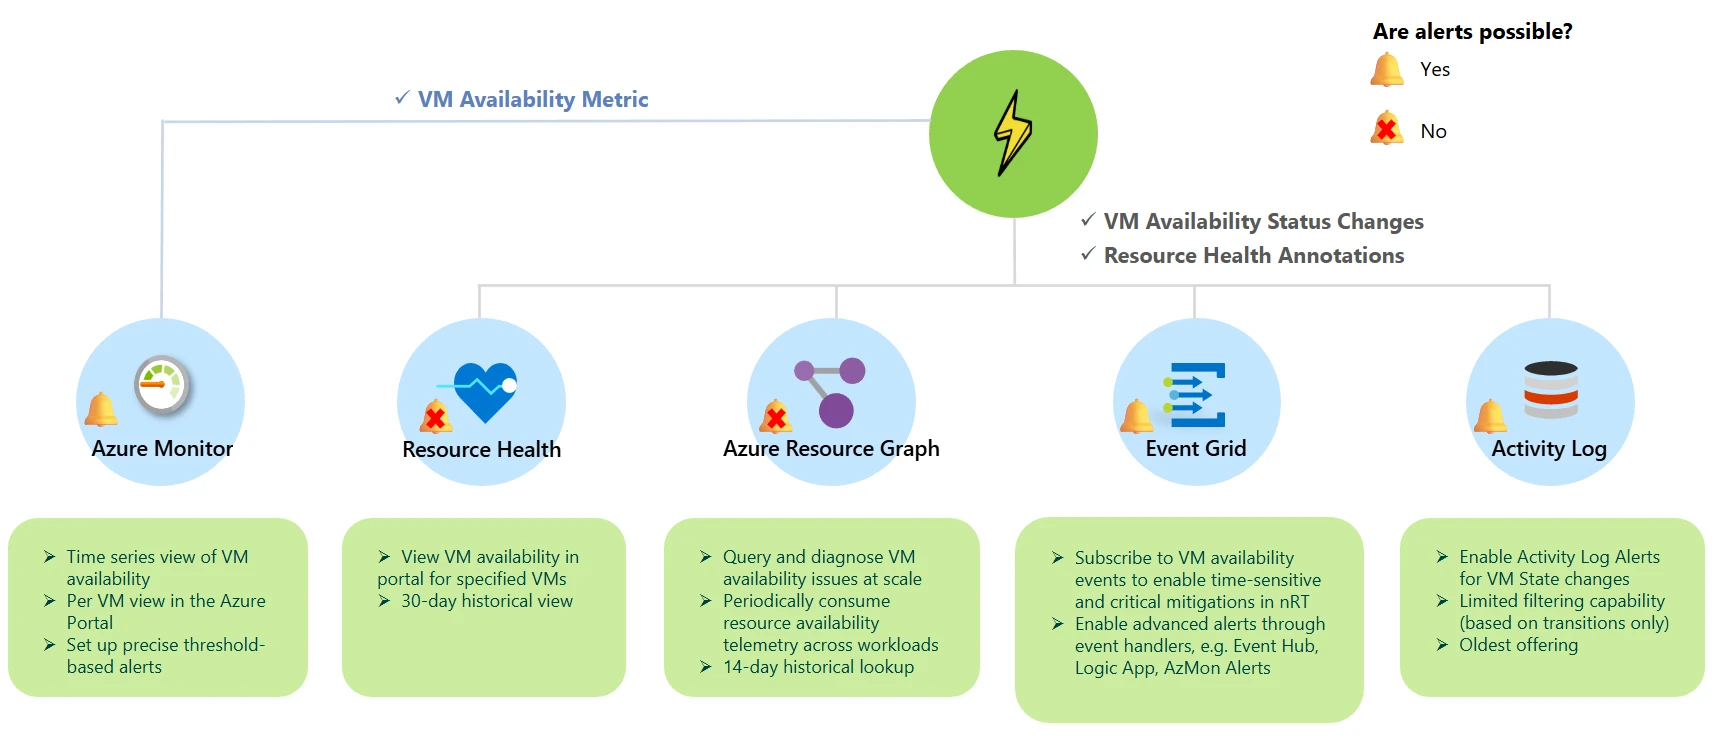
Flash publishes VM availability states and resource health annotations for detailed failure attribution and downtime analysis. The guide below outlines your options so you can choose the right Flash monitoring solution for your scenario.
| Solution | Description |
| Azure Resource Graph (general availability) | For investigations at scale, centralized resource repositories, and historical lookups, you can periodically consume resource availability telemetry across all workloads at once using Azure Resource Graph (ARG). |
| Event Grid system topic (public preview) | To trigger time-sensitive and critical mitigations, such as redeploying or restarting VMs to prevent end-user impact, you can receive alerts within seconds of critical changes in resource availability via Event Handlers in Event Grid. |
| Azure Monitor – Metrics (public preview) | To track trends, aggregate platform metrics (e.g., CPU, disk), and configure precise threshold-based alerts, you can consume an out-of-the-box VM availability metric via Azure Monitor. |
| Resource Health (general availability) | To perform instantaneous and convenient per-resource health checks in the Portal UI, you can quickly view the RHC blade. You can also access a 30-day historical view of health checks for that resource to support fast and effective troubleshooting. |
What’s new?
Public preview: User vs platform dimension introduced for VM availability metric
Many customers have emphasized the need for user-friendly monitoring solutions that provide real-time, scalable access to compute resource availability data. This information is essential for triggering timely mitigation actions in response to availability changes.
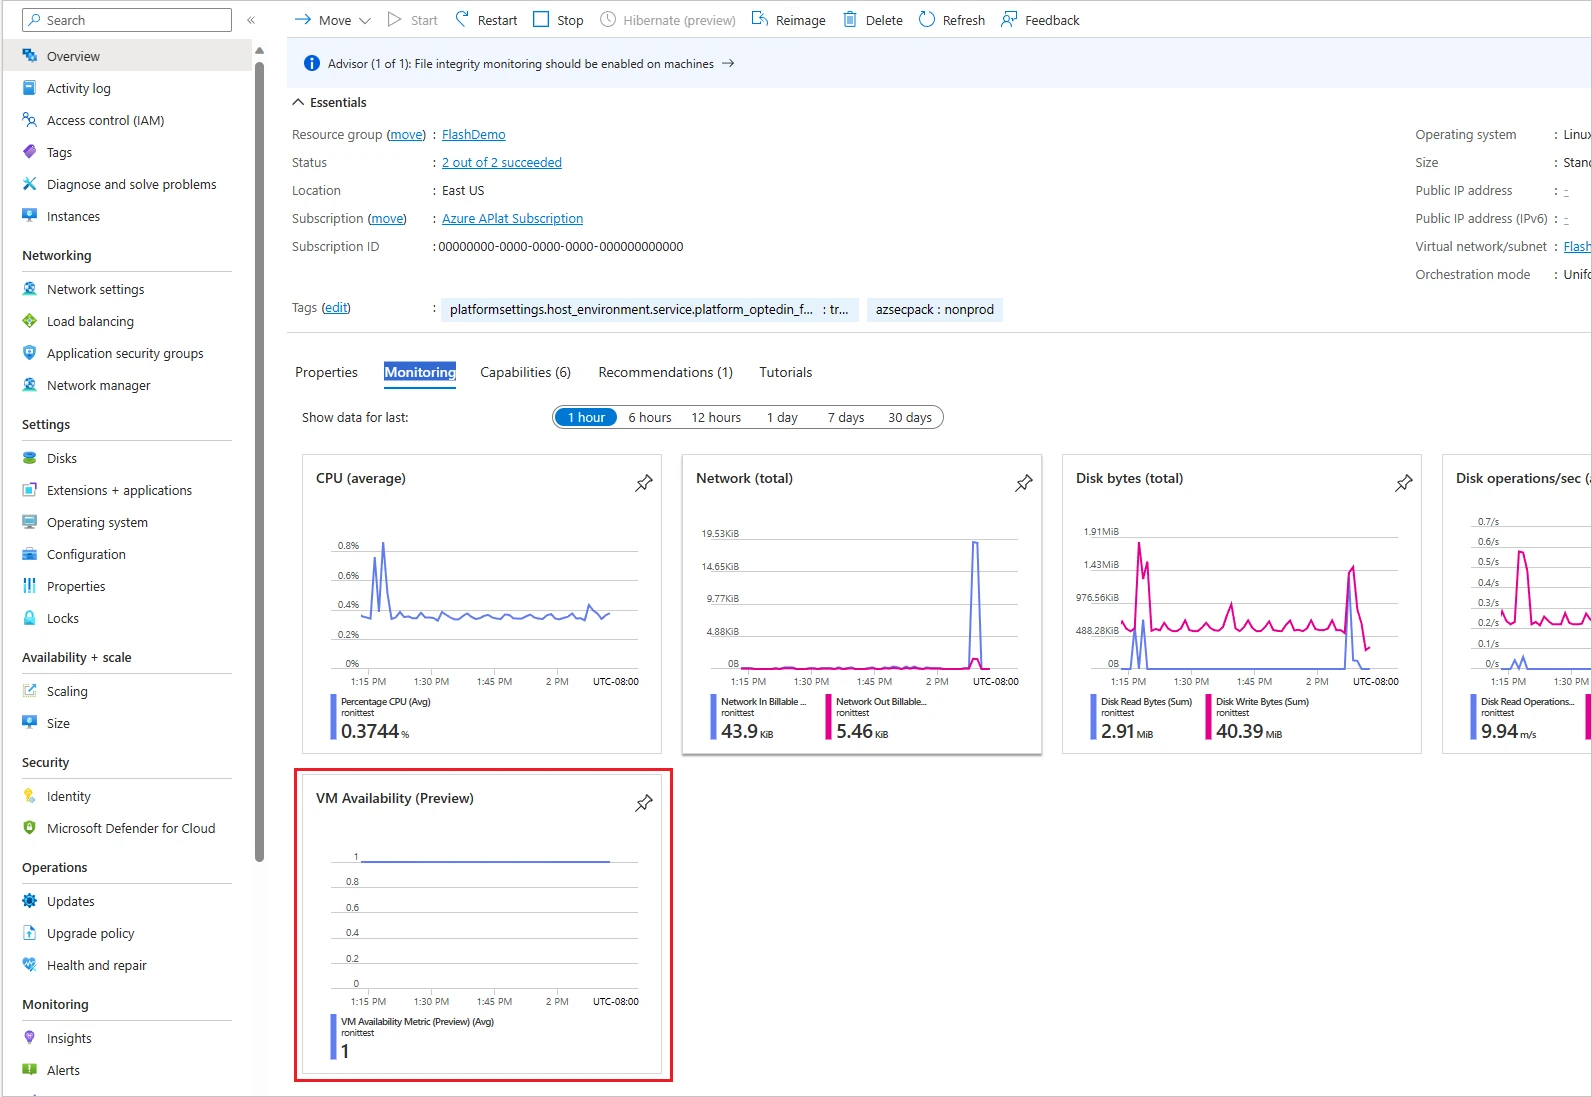
Designed to satisfy this critical need, the VM availability metric is well-suited for tracking trends, aggregating platform metrics (such as CPU and disk usage), and configuring precise threshold-based alerts. You can utilize this out-of-the-box VM availability metric in Azure Monitor.
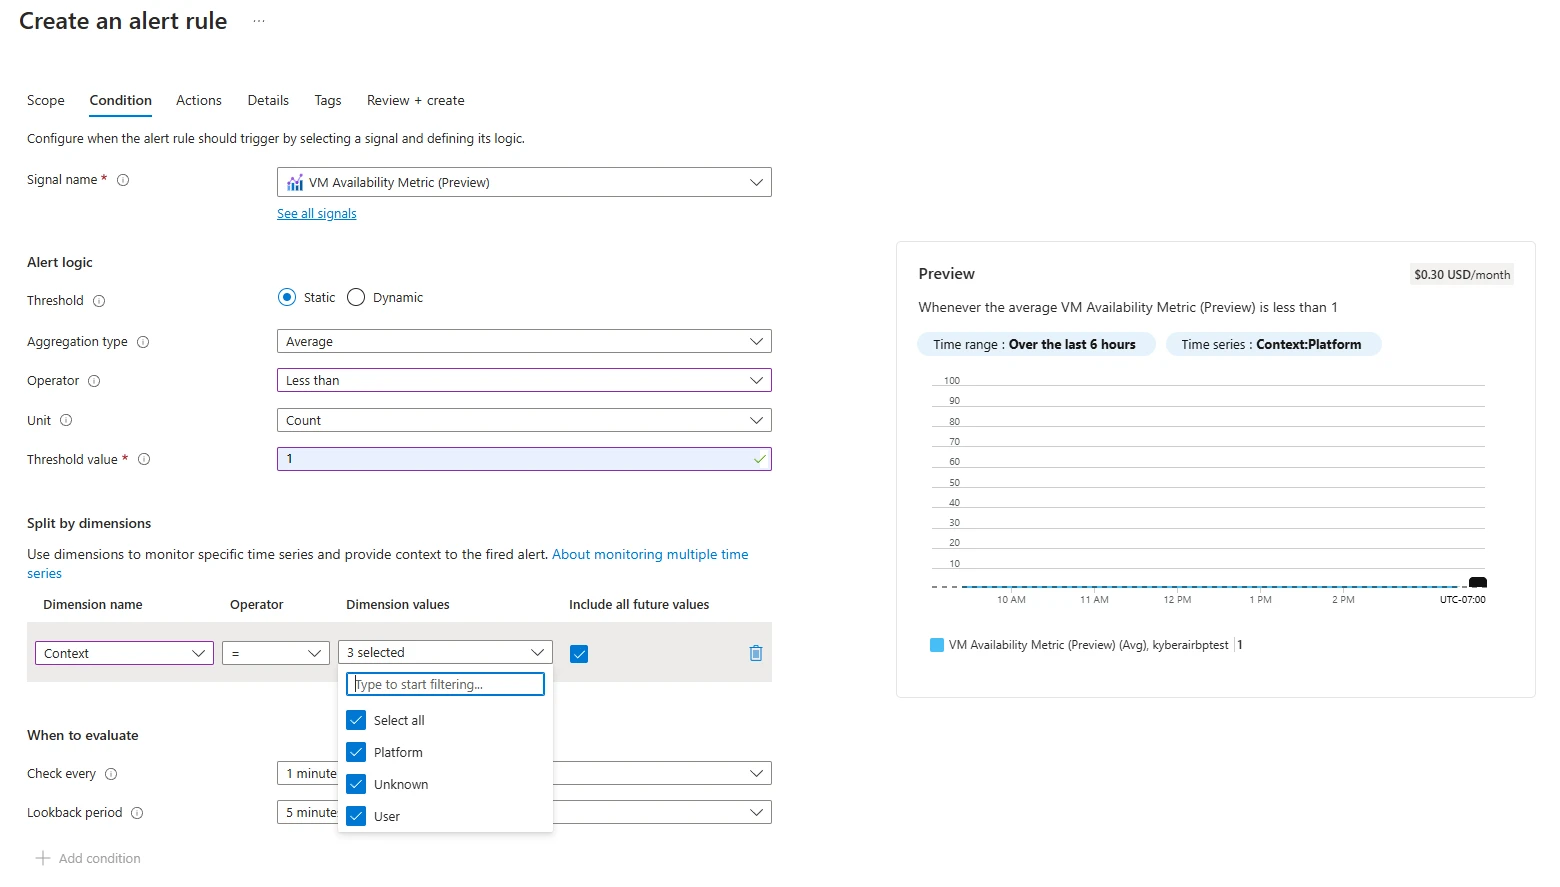
Now you can use the Context dimension to identify whether VM availability was influenced by Azure or user-orchestrated activity. This dimension indicates, during any disruption or when the metric drops to zero, whether the cause was platform-triggered or user-driven. It can assume values of Platform, Customer, or Unknown.
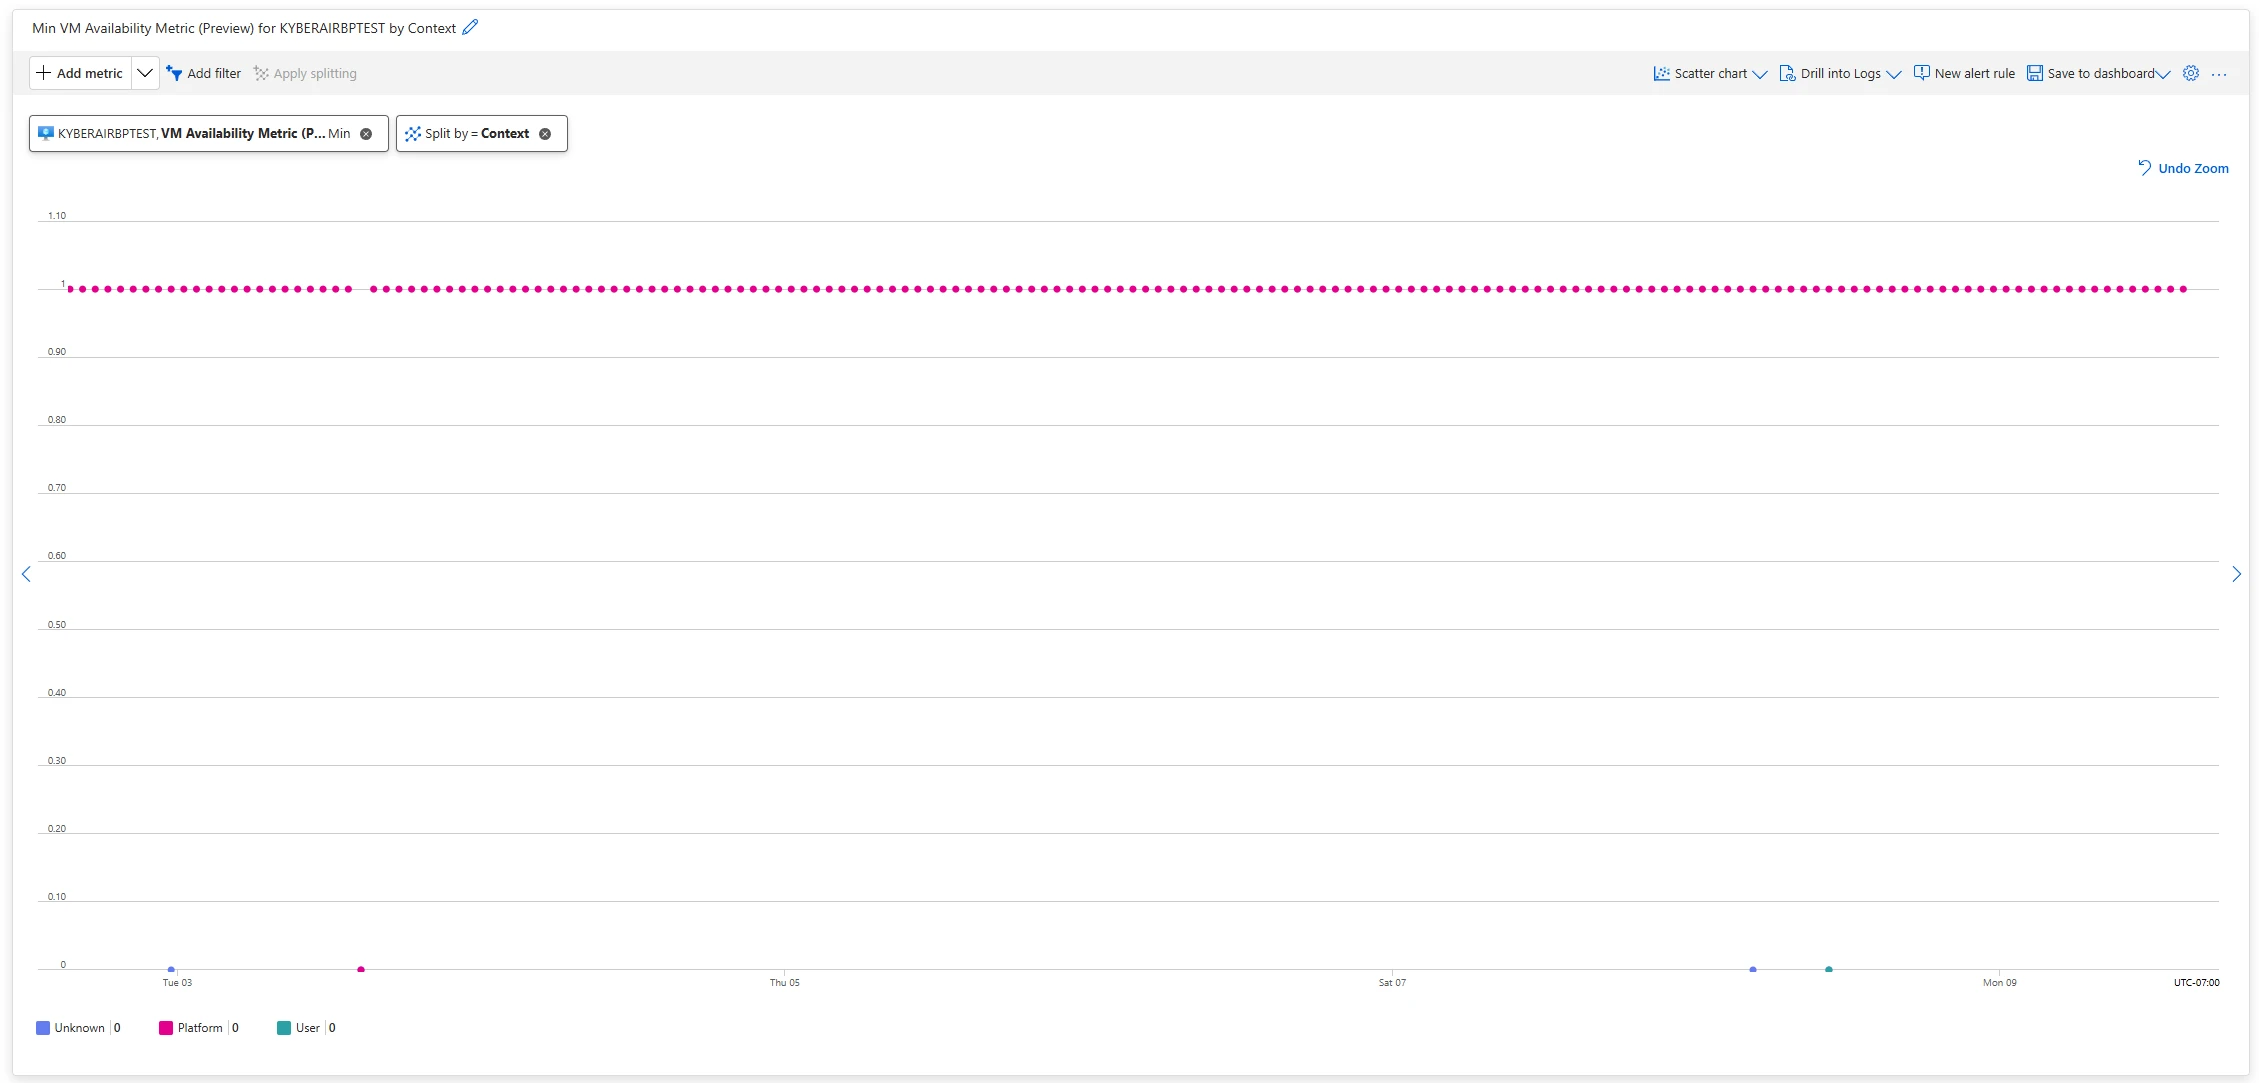
The new dimension is also supported in Azure Monitor alert rules as part of the filtering process.
Public preview: Enable sending health resources events to Azure Monitor alerts in Event Grid
Azure Event Grid is a highly scalable, fully managed Pub/Sub message distribution service that offers flexible message consumption patterns. Event Grid enables you to publish and subscribe to messages to support Internet of Things (IoT) solutions. Through HTTP, Event Grid enables you to build event-driven solutions, where a publisher service (such as Project Flash) announces its system state changes (events) to subscriber applications.
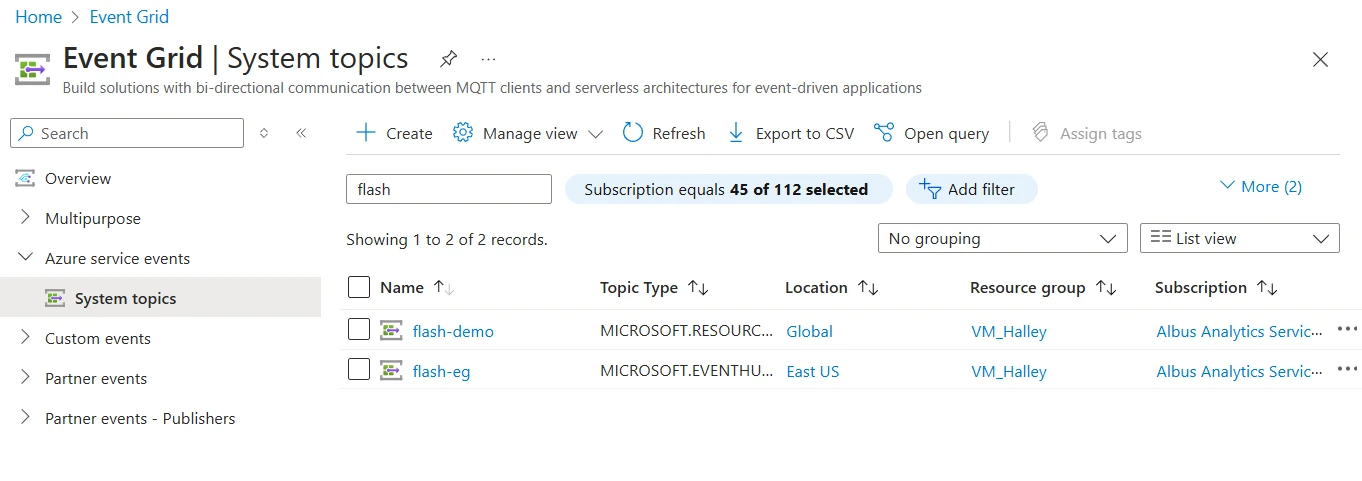
With the integration of Azure Monitor alerts as a new event handler, you can now receive low-latency notifications—such as VM availability changes and detailed annotations—via SMS, email, push notifications, and more. This combines Event Grid’s near real-time delivery with Azure Monitor’s direct alerting capabilities.
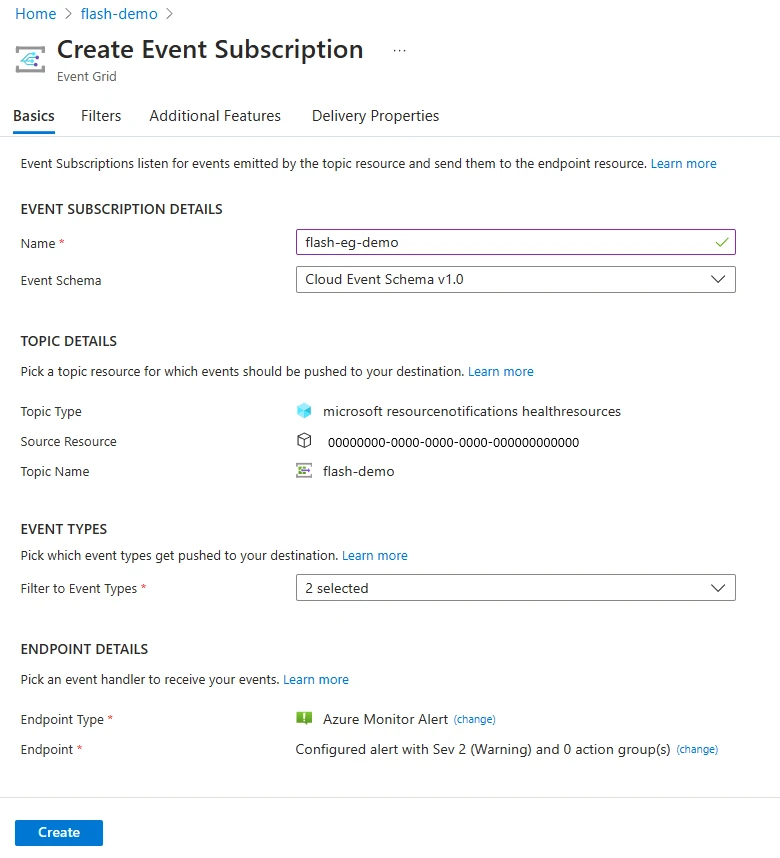
To get started, simply follow the step-by-step instructions and begin receiving real-time alerts with Flash’s new offering.
What’s next?
Looking ahead, we plan to broaden our focus to include scenarios such as inoperable top-of-rack switches, failures in accelerated networking, and new classes of hardware failure prediction. In addition, we aim to continue enhancing data quality and consistency across all Flash endpoints—enabling more accurate downtime attribution and deeper visibility into VM availability.
For comprehensive monitoring of VM availability—including scenarios such as routine maintenance, live migration, service healing, and degradation—we recommend leveraging both Flash Health events and Scheduled Events (SE).
- Flash Health events offer real-time insights into ongoing and historical availability disruptions, including VM degradation. This facilitates effective downtime management, supports automated mitigation strategies, and enhances root cause analysis.
- Scheduled Events, in contrast, provide up to 15 minutes of advance notice prior to planned maintenance, enabling proactive decision-making and preparation. During this window, you may choose to acknowledge the event or defer actions based on your operational readiness.
For upcoming updates on the Flash initiative, we encourage you to follow the advancing reliability series!