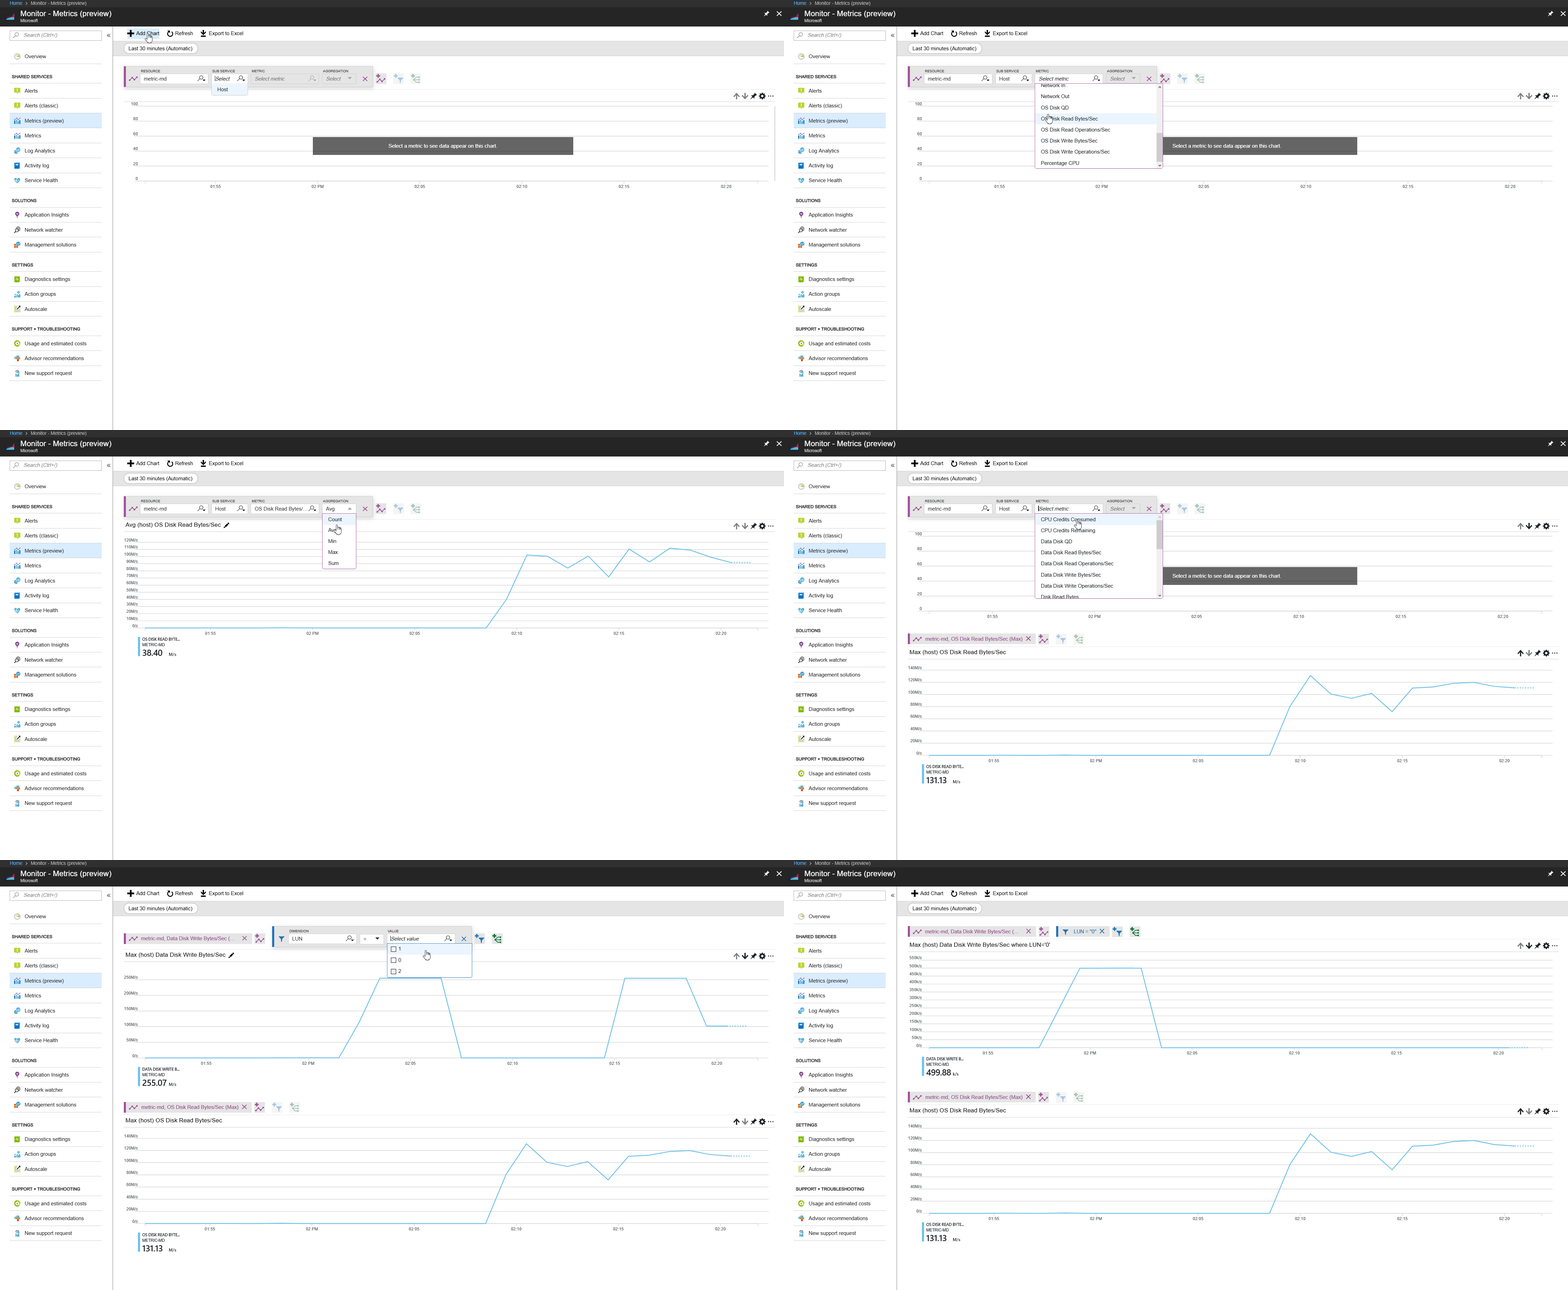
Today we’re sharing the public preview of per disk metrics for all Managed & Unmanaged Disks. This enables you to closely monitor and make the right disk selection to suit your application usage pattern. You can also use it to create alerts, diagnosis, and build automation.
Prior to this, you could get the aggregate metrics for all the disks attached to the virtual machine (VM), which provided limited insights into the performance characteristics of your application, especially if your workload is not evenly distributed across all attached disks. With this release, it is now very easy to drill down to a specific disk and figure out the performance characteristics of your workload.
Here are the new metrics that we're enabling with today's preview:
- OS Disk Read Operations/Sec
- OS Disk Write Operations/Sec
- OS Disk Read Bytes/sec
- OS Disk Write Bytes/sec
- OS Disk QD
- Data Disk Read Operations/Sec
- Data Disk Write Operations/Sec
- Data Disk Read Bytes/sec
- Data Disk Write Bytes/sec
- Data Disk QD
The following GIF shows how easy it is to build a metric dashboard for a specific disk in the Azure portal.
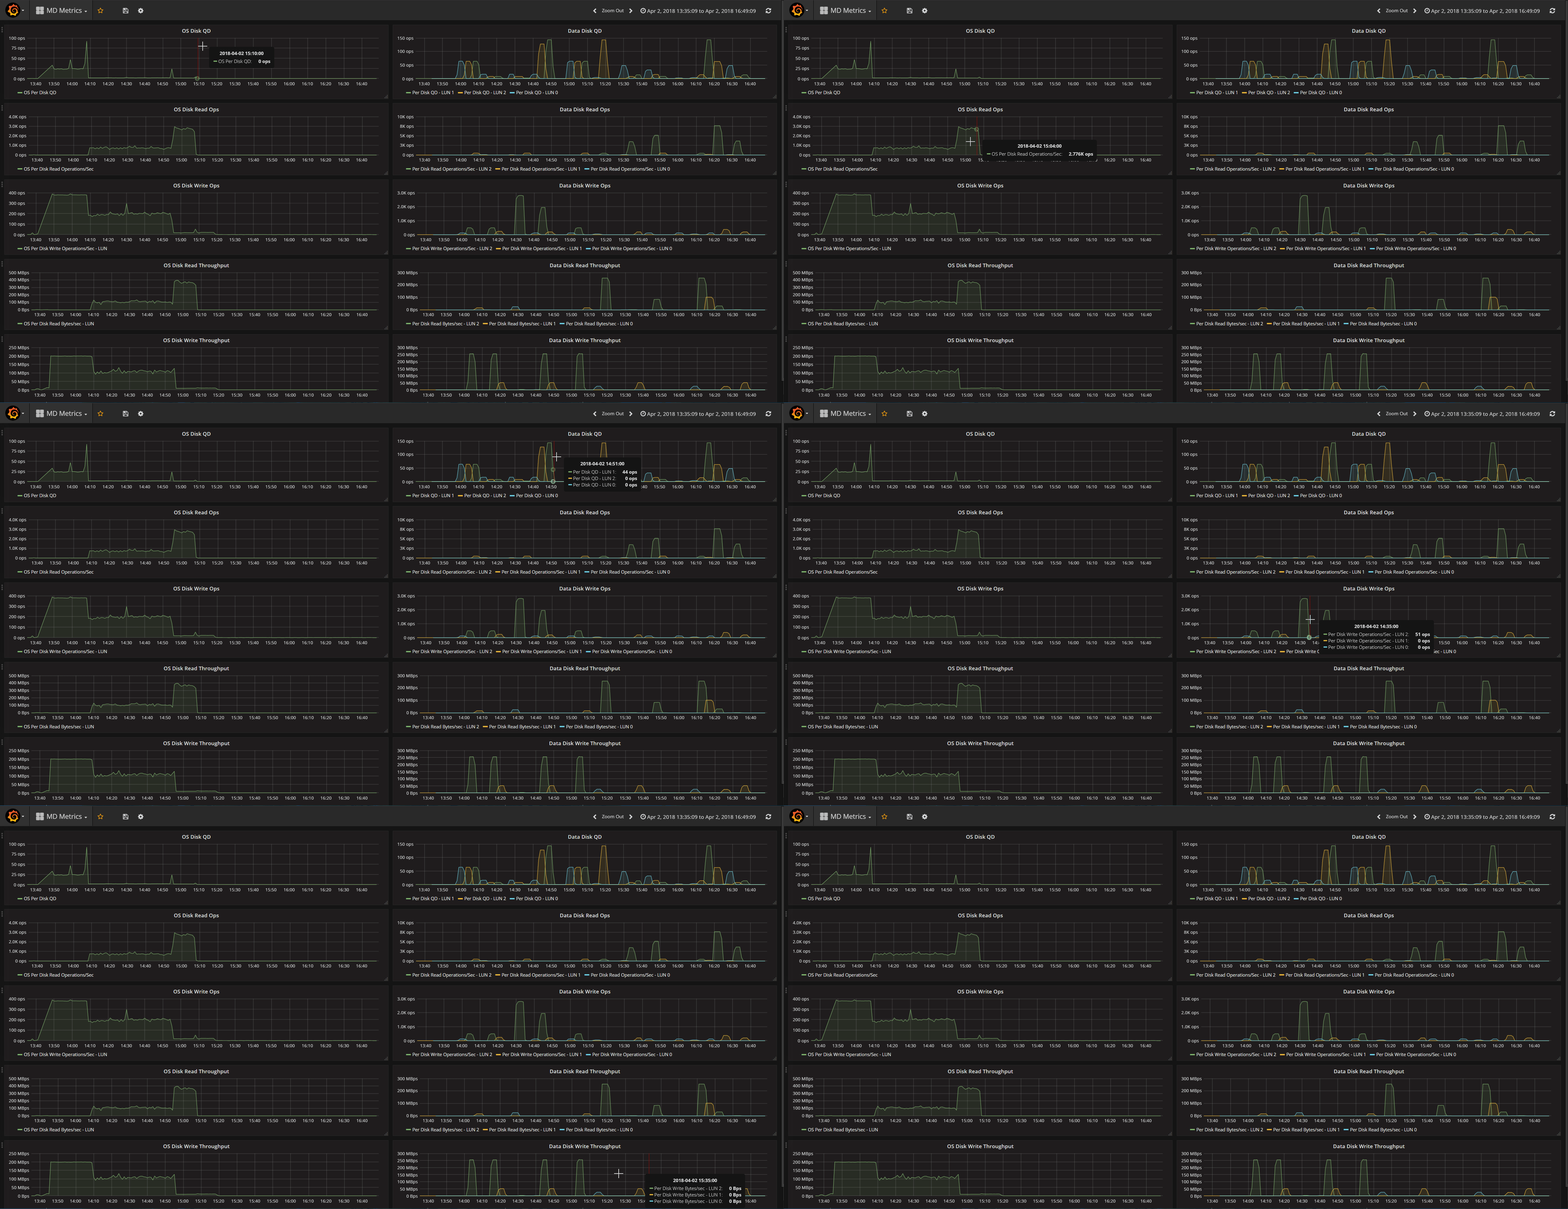
Additionally, because of Azure Monitor integration with Grafana, it’s very easy to build a Grafana dashboard with these metrics. Here’s a GIF that shows a Grafana dashboard setup with metrics from a VM with 1 OS disk and 3 data disks.
Azure CLI
With Azure CLI it’s very easy to get the metric values programmatically. First, we need to get the list of metric definitions for a particular resource
➜  ~ az monitor metrics list-definitions --resource /subscriptions//resourceGroups/metric-rg/providers/Microsoft.Compute/virtualMachines/metric-md

Display Name                    Metric Name                       Unit            Type     Dimension Required    Dimensions
------------------------------  --------------------------------  --------------  -------  --------------------  ------------
Percentage CPU                  Percentage CPU                    Percent         Average  False
Network In                      Network In                        Bytes           Total    False
Network Out                     Network Out                       Bytes           Total    False
Disk Read Bytes                 Disk Read Bytes                   Bytes           Total    False
Disk Write Bytes                Disk Write Bytes                  Bytes           Total    False
Disk Read Operations/Sec        Disk Read Operations/Sec          CountPerSecond  Average  False
Disk Write Operations/Sec       Disk Write Operations/Sec         CountPerSecond  Average  False
CPU Credits Remaining           CPU Credits Remaining             Count           Average  False
CPU Credits Consumed            CPU Credits Consumed              Count           Average  False
Data Disk Read Bytes/Sec        Per Disk Read Bytes/sec           CountPerSecond  Average  False                 SlotId
Data Disk Write Bytes/Sec       Per Disk Write Bytes/sec          CountPerSecond  Average  False                 SlotId
Data Disk Read Operations/Sec   Per Disk Read Operations/Sec      CountPerSecond  Average  False                 SlotId
Data Disk Write Operations/Sec  Per Disk Write Operations/Sec     CountPerSecond  Average  False                 SlotId
Data Disk QD                    Per Disk QD                       Count           Average  False                 SlotId
OS Disk Read Bytes/Sec          OS Per Disk Read Bytes/sec        CountPerSecond  Average  False
OS Disk Write Bytes/Sec         OS Per Disk Write Bytes/sec       CountPerSecond  Average  False
OS Disk Read Operations/Sec     OS Per Disk Read Operations/Sec   CountPerSecond  Average  False
OS Disk Write Operations/Sec    OS Per Disk Write Operations/Sec  CountPerSecond  Average  False
OS Disk QD                      OS Per Disk QD                    Count           Average  False
Once, we have a list of metrics, we can get the values for a specific metric, for example Data Disk Write Bytes/Sec in this case.
➜ ~ az monitor metrics list --resource /subscriptions//resourceGroups/metric-rg/providers/Microsoft.Compute/virtualMachines/metric-md --metric 'Per Disk Write Bytes/Sec' --aggregation Maximum --filter "SlotId eq '1'" --interval PT1M --start-time 2018-04-02T21:35:09Z --end-time 2018-04-03T00:49:09Z

Timestamp            Name                         Slotid      Maximum
-------------------  -------------------------  --------  -----------
2018-04-02 21:35:00  Data Disk Write Bytes/Sec         1
2018-04-02 21:36:00  Data Disk Write Bytes/Sec         1
2018-04-02 21:37:00  Data Disk Write Bytes/Sec         1
2018-04-02 21:38:00  Data Disk Write Bytes/Sec         1
2018-04-02 21:39:00  Data Disk Write Bytes/Sec         1
2018-04-02 21:40:00  Data Disk Write Bytes/Sec         1
2018-04-02 21:41:00  Data Disk Write Bytes/Sec         1
2018-04-02 21:42:00  Data Disk Write Bytes/Sec         1
2018-04-02 21:43:00  Data Disk Write Bytes/Sec         1
2018-04-02 21:44:00  Data Disk Write Bytes/Sec         1
2018-04-02 21:45:00  Data Disk Write Bytes/Sec         1
2018-04-02 21:46:00  Data Disk Write Bytes/Sec         1
2018-04-02 21:47:00  Data Disk Write Bytes/Sec         1  1.01974e+08
2018-04-02 21:48:00  Data Disk Write Bytes/Sec         1  1.02015e+08
2018-04-02 21:49:00  Data Disk Write Bytes/Sec         1  1.02041e+08
2018-04-02 21:50:00  Data Disk Write Bytes/Sec         1  1.01976e+08
2018-04-02 21:51:00  Data Disk Write Bytes/Sec         1  6.37246e+07


