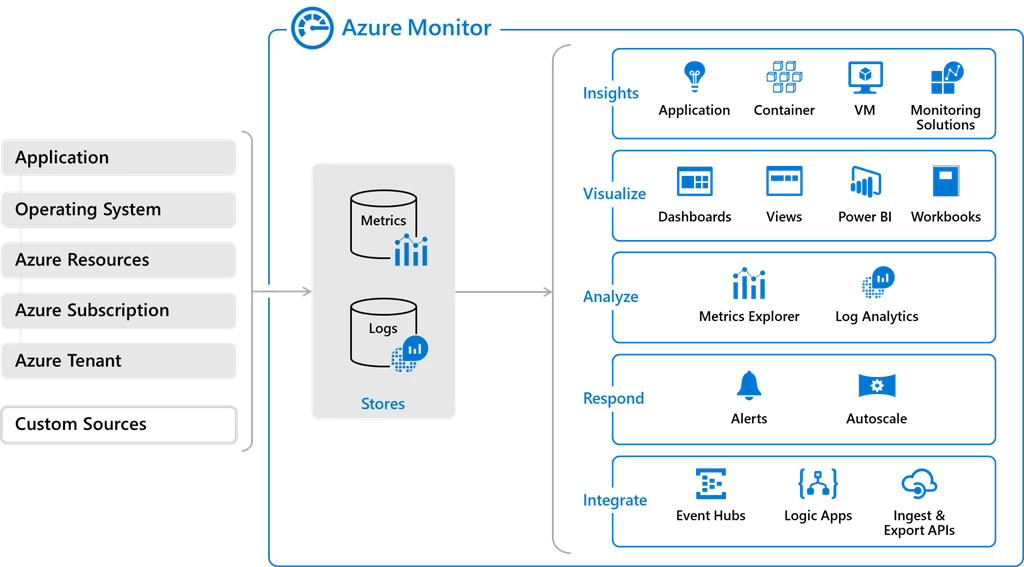
Your customers expect your applications to always be up and running. When that isn’t the case, it is critical that you quickly understand where the issues are – in the infrastructure or in code – and address them. Today as part of the Ignite Conference, I am excited to announce that we are bringing together our existing capabilities for monitoring infrastructure, apps and networks into one unified offering that delivers full stack monitoring for your applications.
Azure Log Analytics and Azure Application Insights are now available as integrated features within Azure Monitor, without any loss or compromise of any capability, and with the same pricing. We are excited about the new capabilities we are adding to Azure Log Analytics and Azure Application Insights and the end-to-end insights we will provide by consolidating these tools in Azure Monitor. The unification of our monitoring experiences is a significant milestone and will provide DevOps and SRE teams the observability they need for complex modern applications.

Full-stack unified monitoring through Azure Monitor
Unified monitoring
Metrics, logs, and alerts are the foundational pillars for monitoring; Over the past few months, you may have noticed the changes we have been making both to our backend and our user interface across all our monitoring tools. We are happy to announce that we now have One Metrics, One Logs, and One Alerts experience across all our monitoring tools.
- One Metrics: Metrics are collected automatically from most of the Azure services you use, and you can send custom metrics or enable additional metrics for scenario-specific solutions for apps, VMs, containers, etc. These metrics are available in near real-time, and you can create your own multi-dimensional custom charts for visualizations.
- One Logs: Azure Monitor is now the central platform for collecting logs from across monitoring, management, security and all other log types in Azure. The Log Analytics search and query experience is now embedded directly in Azure Portal and can be used to run diagnostics, root-cause analyses, statistics, visualizations and answer any other ad-hoc questions.
- One Alerts: The new alert management experience launched earlier this year is now available for all resources in Azure. These alerts can proactively notify you of critical conditions and potentially take corrective action. You can setup logs-based or metrics-based alerts with multi-resource & multi-timeseries rules, and configure action groups for notifications, integrations or automation.
Full stack, end-to-end visibility via Resource Groups
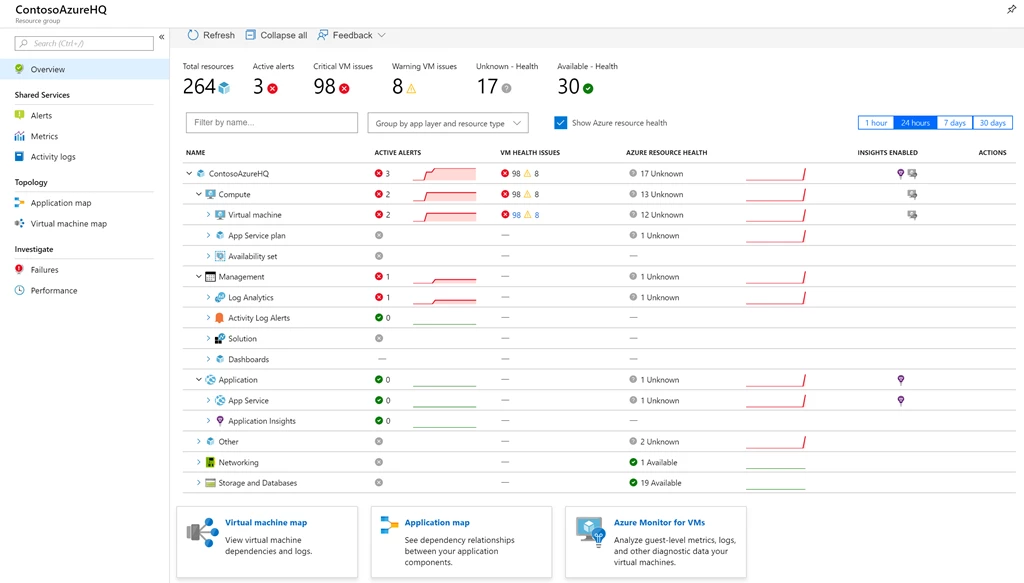
Your applications often depend on different types of Azure resources like VMs, containers, storage accounts, databases, and more. After hearing from many of you that you use resource groups to organize your apps and workloads, we are announcing Azure Monitor for resource groups, showing the state of all your resources in a single view. If your application has any issues – whether it be in the code, or a container or a VM – you should see it immediately in the resource group view. You can quickly see alerts and check for any health issues, jumping to relevant diagnostic tools like application map or virtual machine map as needed.

Rich insights for Virtual Machine environments
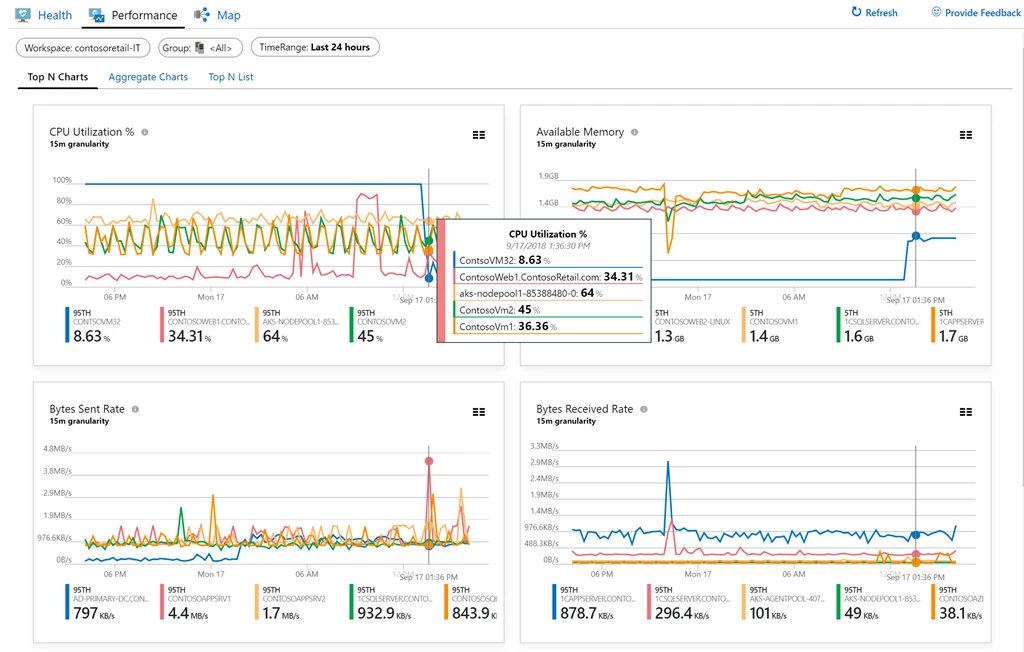
We are launching a new preview capability, Azure Monitor for VMs which provides an in-depth view across health, performance and dependencies from the VM resource blade, Azure Monitor and Resource Group. Whether you are running workloads on a single VM or at scale, you can see how application performance is impacted by VMs that are resource constrained.
You can easily discover and isolate resource constrained VMs, based on resource utilization, connection metrics, health signals and alerts. Within a VM you can troubleshoot guest-level performance issues and identify which of the core components like CPU, memory, disk and network that are constrained. With maps you can visualize and identify service dependencies, monitor connection failures and identify which clients of the VM may be impacted. You can now also easily on-board entire resource groups and subscriptions using PowerShell or using Azure Policy.

In addition, we are also announcing the following new capabilities in Azure Monitor, which we are excited to share today:
- Azure Monitor integration into native Azure resource blades such as Azure App Services, Azure VMs or Azure Kubernetes Services. You can now easily monitor metrics, logs, alerts & insights directly without jumping out of context.
- There is a new multi-cluster health rollup view for Azure Kubernetes Service (AKS) which spans across subscriptions and workspaces. You can now also onboard to monitor your AKS clusters when deploying Azure DevOps Projects.
- Support for secured monitoring inside Virtual Networks and logging to firewall restricted secured Storage accounts.
- Support for distributed tracing for Python & Go apps in addition to our existing support for .NET, Java & Node.js in Application Insights.
- Application Insights now supports pre-aggregated metrics that enable near real-time alerting on metrics dimensions, and retain high precision even when using sampling or filtering.
Our mission for Azure Monitor is to empower organizations to deliver successful application services through timely, actionable, data-driven insights. Today’s launch is an important milestone on this journey. We are excited about Azure Monitor and confident that it will help you face the ever-changing challenges with monitoring modern cloud applications. You can learn more about using Azure Monitor and get started here.
