This post was written by Jaime Espinosa, Program Manager on the Azure Web Sites Team
With the availability of Remote Debugging, Microsoft brings you a cohesive and unified web development experience from beginning to end. Microsoft Visual Studio can connect and interact with the cloud as if the whole cloud is sitting right under your desk. Web developers can create, publish and debug Azure-hosted websites all from a single development environment. The integration of Visual Studio and Azure Websites speeds up development and helps reduce bugs.
Microsoft Visual Studio 2013 includes many improvements to how developers interact with the debugger. Debugging is an important part of the overall design flow whether you are learning to develop or have many years of experience. Website remote debugging can be done with Visual Studio 2012, but there are many improvements to debugging with Visual Studio 2013. For more information see the Visual Studio product page.
Azure Websites Remote Debugging connects two of Microsoft’s most powerful technologies, the Azure cloud and Visual Studio. You can connect Visual Studio to your own Azure Website and gain full control. You can set breakpoints, manipulate memory directly, step through code and even change the code path. It’s the only way to truly see how your website behaves in the wild.
The ability to do remote debugging makes a big difference in rapid development. It facilitates maintenance and enables folks to create better sites. There is a lot of power and flexibility in Visual Studio as a tool for this remote debugging. Hopefully with some background context on how everything works, you can make the best use of the tool and feature.
Remote Debugging in Azure Web Sites
There are two ways to connect to the Remote Debugger session on Azure Web Sites: manually or automatically.
To get the most out of any tool and especially a debugging tool, it is worth knowing how it all works. We will go into more details about how the Remote Debugger works in the 2nd part of this series. Later on, in part 3, we will address users who have expanded their websites to scale out to multiple instances as well as using GIT to deploy and maintain your website.
There are countless additional articles, blogs and tutorials on how to use Visual Studio’s Remote Debugger in general. I encourage you to explore, experiment and share.
What’s next?
There are a few things worth mentioning, based on customer questions we have seen. We plan to provide a way to route traffic away from the instance being debugged, manually and/or automatically. The ability to attach and step into a process on startup is being investigated, but it’s not conclusive. The Windows user-name restrictions have been fixed; which used to be constrained to <20 characters).
Tier Limits
Remote debugging is available to all tiers; however, there are some limitations depending on the tier. The breakdown is as follows: Free and Shared (Basic) tiers are allowed one connection at any given time. The Standard tier is allowed five simultaneous connections.
Warning Sticker
Unfortunately, we must leave you with a warning sticker; but, we are working to remove it.

Connecting the Visual Studio Remote Debugger to Azure Web Sites
It is possible to attach the Visual Studio Remote Debugger in two different ways; manually and automatically. The manual procedure works with Visual Studio 2012 and 2013 out of the box (it is not available in Express versions). The automatic procedure is much simpler, but does require that the client machine has the Azure SDK installed, and the subscription profile downloaded.
Being able to manually attach a remote debugger to an arbitrary process has many benefits. Not only can you debug the website process (W3WP), but you can also debug processes on WebJobsor any other kind of process ran in Azure Web Sites. Visual Studio and its debugger are built for .NET, but VS offers a lot of flexibility that extends to additional tools.
On the other hand, the Azure SDK, brings a more cohesive website development and maintenance story. From a single tool (Visual Studio) you can author, deploy, and remote debug a website with minimal effort. This is very useful when doing rapid development and/or when you are managing a large number of websites. The SDK is always evolving to bring a simple and cohesive experience.
Regardless of which method you choose, there are some things that need to happen that you should be aware of on the server side. The Remote Debugging feature needs to be turned on, and the version of Visual Studio needs to be defined on your Web Site’s configuration in Azure. To better understand how this all works, please find the blog on “Inside Remote Debugger in Azure Web Sites (Azure Web Sites)”.
Steps for Connecting Automatically
There are several blogs on Azure Websites Remote Debugging that you may want to check out, including a video from the developer that brought us this feature. Rather than providing yet another example, I’ll refer you to these materials:
- The Azure documentation walks through a great example, Troubleshooting Windows Azure Web Sites in Visual Studio.
- The .NET Web Development and Tool Blog also offers a walk-through, Remote Debugging a Window Azure Web Site with Visual Studio 2013.
- There’s a video where the developer walks through an example, here, in the first 9 minutes.
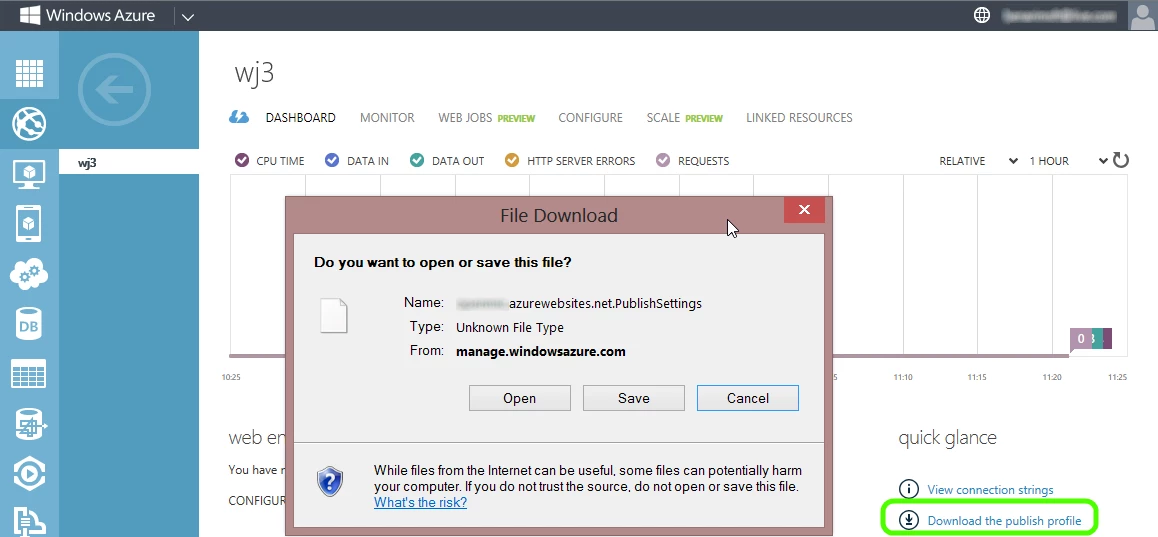
It might be useful to note that you can download your publishing profile in the following ways:
- From https://windows.azure.com/download/publishprofile.aspx
- Using the PowerShell command: Get-AzurePublishSettingsFile
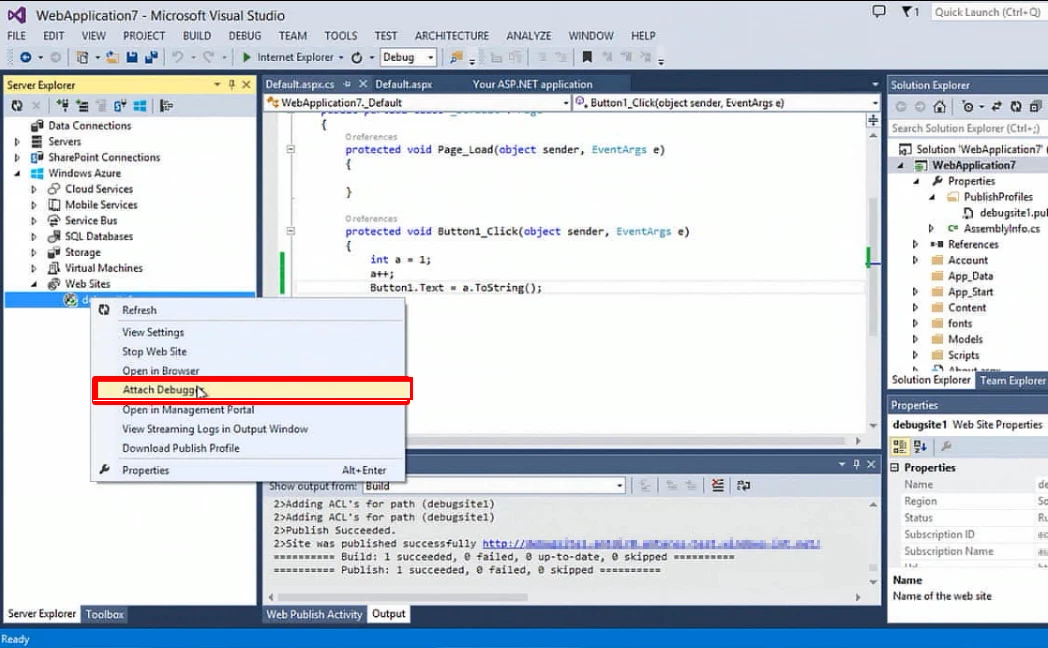
Steps for Connecting Manually
Steps 1-6 illustrate how to set up WebDeploy in Visual Studio. Alternatively, you can Publishing from Source Control to Windows Azure Web Sites, and make the necessary changes for Using Remote Debugger with GIT deployments in Azure Web Sites.
Step 1. Setup up your deployment credentials: USER NAME and PASSWORD
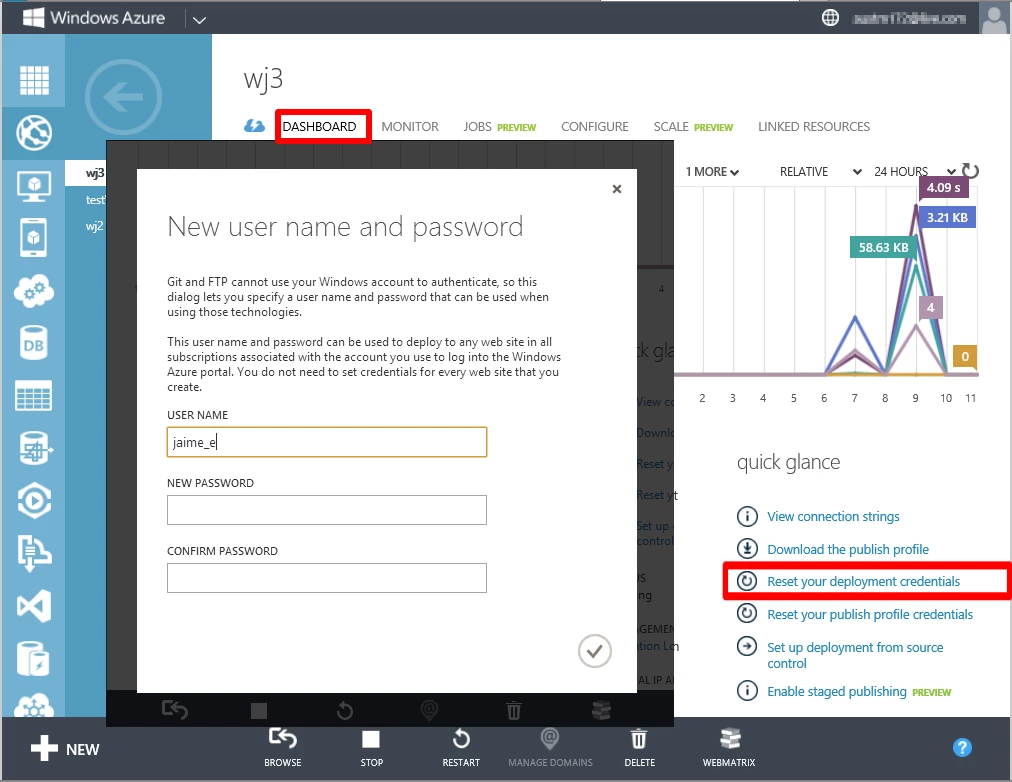
Step 2. Download the publishing profile
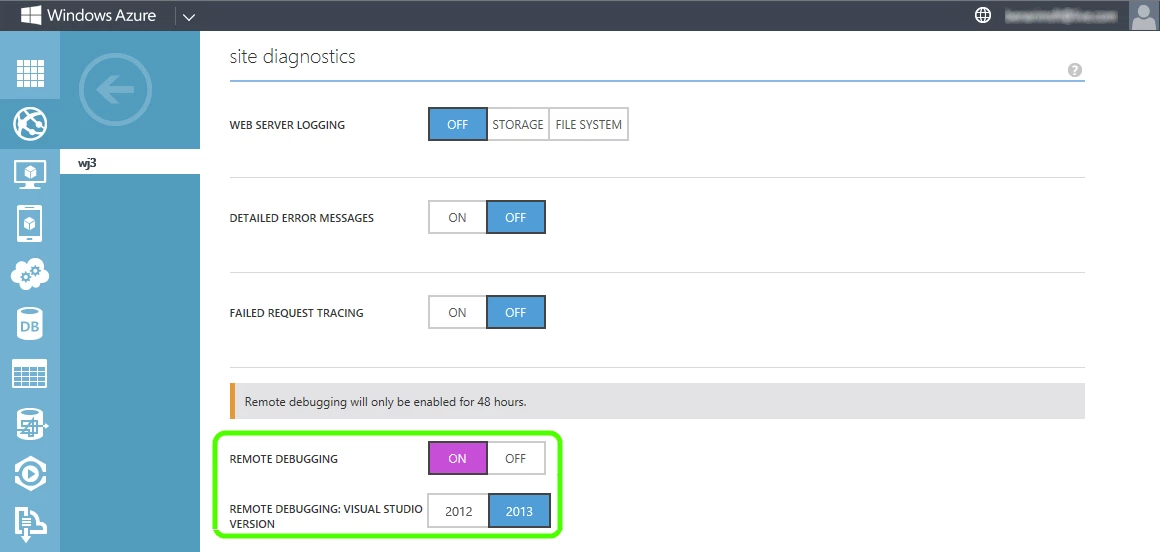
Step 3. Enable Remote Debugging and specify the version of Visual Studio. Note that when you save these settings, it will activate Remote Debugging using the currently saved deployment credentials.
Step 4. Import the publishing profile. Notice that on this capture, “Import from a Windows Azure Website” section is present because the SDK was installed.

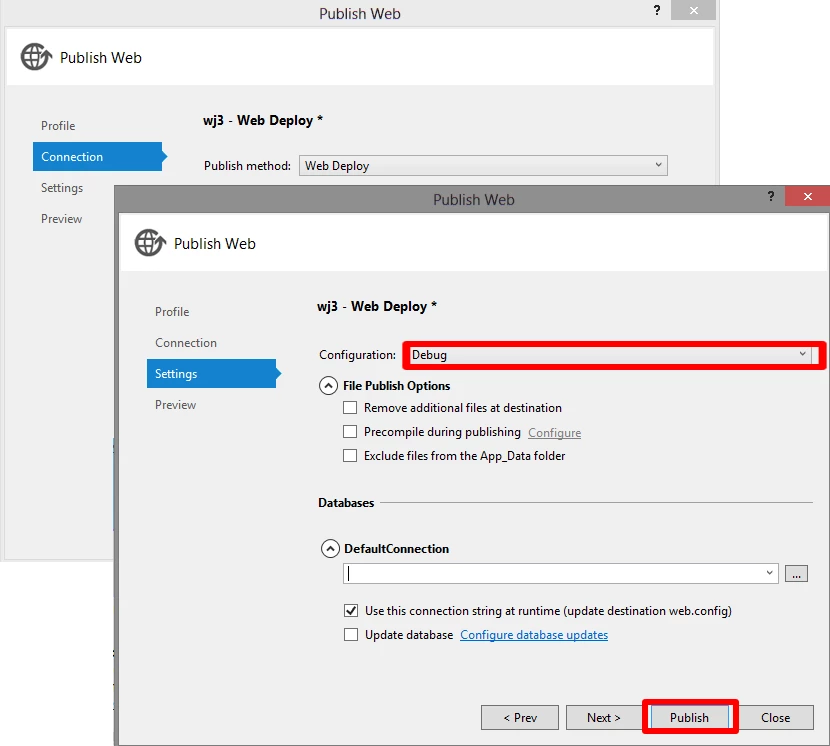
Step 5. Configure what you publish to your website
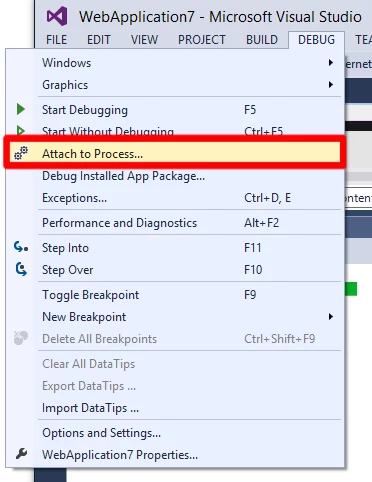
Step 6. Attach the Visual Studio Debugger to your remote process
Step 7. Specify where your process resides and how to connect
Qualifier: <The URL to your website (without http*)> User and Password: Use the credentials you created in step 1. Note that the Dot back-slash that prefaces the credentials.

Step 8. Select the process you want to debug. Note that the published website is the W3WPprocess. If there is more than one, you will need to experiment to figure out which is your site.

Now that we’ve gone through the basics, you can start applying this knowledge. However, this is only the tip of the iceberg. In the next posts in this series, we will cover additional topics including an inside look into remote debugging, multi-instance environments and GIT deployment debugging.
