Today, we are pleased to announce the general availability of App Service diagnostics. It provides an intelligent and interactive experience, analyzes what’s wrong with your web apps and quickly guides you to the right information to help troubleshoot and resolve issues faster.
Proactive application health checkup
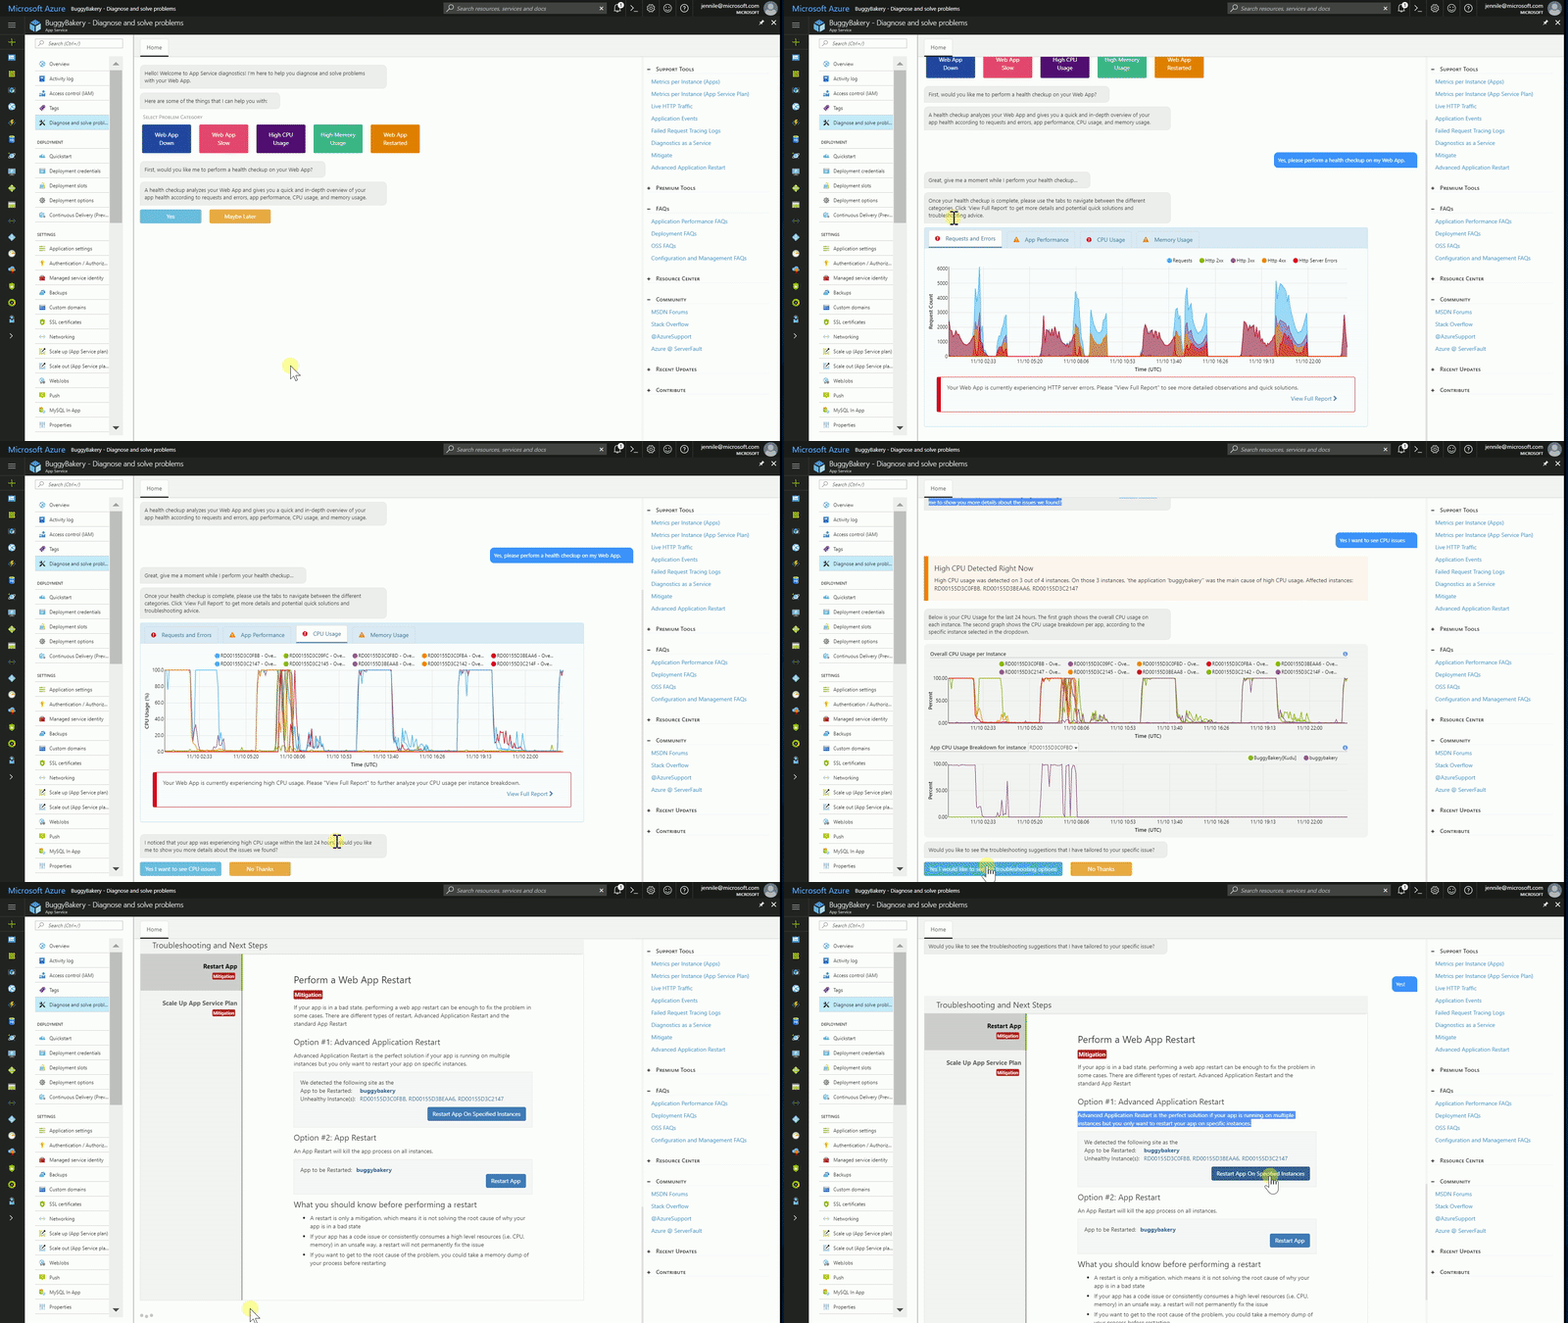
With Azure App Service diagnostics, you can run proactive health checkups against common web app metrics and tap into a pool of built-in knowledge which will help you troubleshoot efficiently. The experience provides you with a quick, interactive overview that either tells you that your app is healthy or identifies unhealthy areas. Behind the scenes, it will detect issues in four areas Requests and Errors, Performance, CPU Usage, and Memory Usage, which are common problem areas we have seen for web applications over the years.

Actionable insights
There are many factors that can impact web applications health and performance. Isolating and addressing those factors can be challenging. App Service diagnostics provides relevant metrics based on problem categories and actionable insights that take the guesswork away.
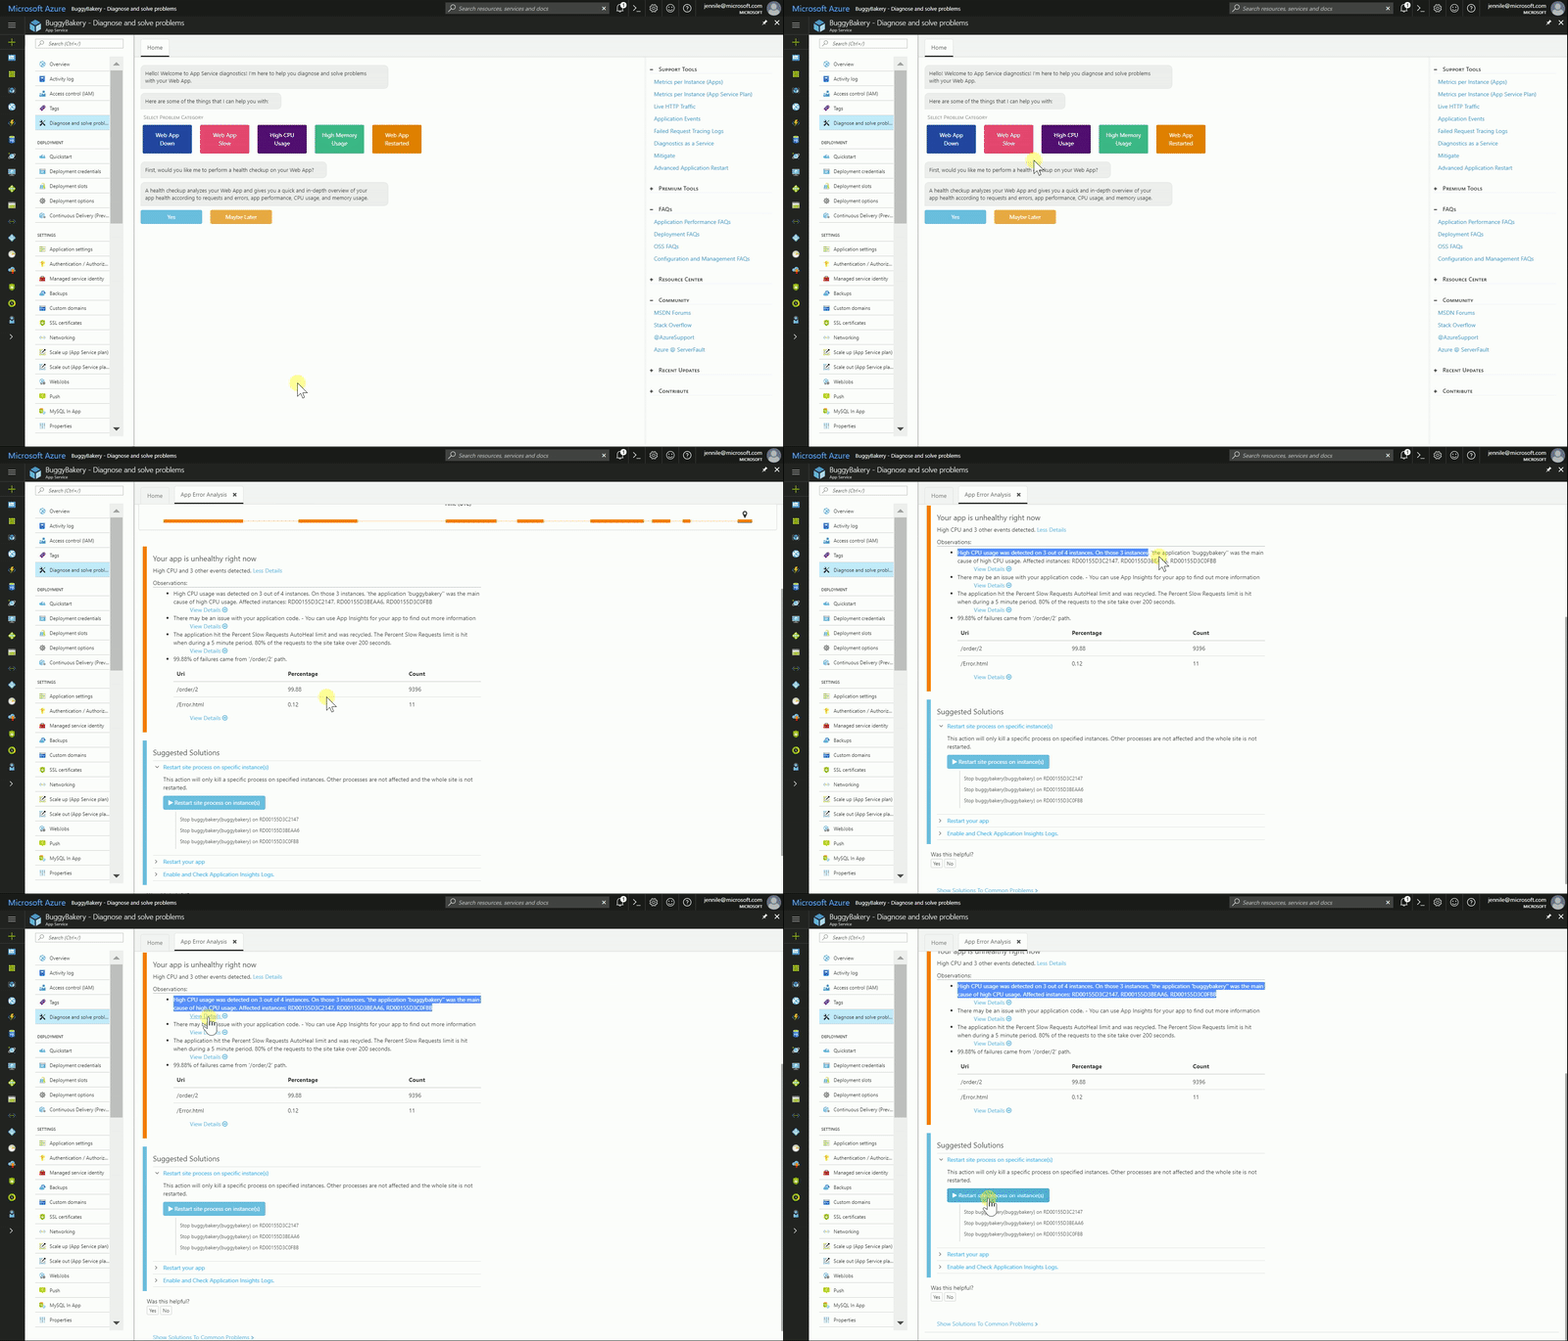
Let’s dive into an example web app (see below image). This app appears to perform well except when it is under load. The poor performance could originate from any of the underlying components, database, CPU, network, memory, disks etc. This is where App Service diagnostics can help and guide you to the root cause faster. In this example, it has identified that the web app is receiving HTTP server errors. Opening up the error analysis tab, you can further drill down to the specific timeframe when your web app experienced downtime. Next, under Observations tab you can find the source of the problem, which in this case happens to be high CPU usage.

Powered by a massive data set with information from Microsoft’s existing support center, App Service diagnostics reduces the chance of trial and error and expedites problem resolution by recommending potential solutions. It also provides list of helpful links for further investigation.
You can learn more about App Service diagnostics here. If you have any feedback or suggestions, please start a new post here.
