We’re happy to introduce the new Grafana integration with Microsoft Azure Monitor logs. This integration is achieved through the new Log Analytics plugin, now available as part of the Azure Monitor data source.
The new plugin continues our promise to make Azure’s monitoring data available and easy to consume. Last year, in the v1 of this data source we exposed Azure Monitor metric data in Grafana. While you can natively consume all logs in Azure Monitor Log Analytics, our customers also requested to make logs available in Grafana. We have heard this request and partnered with Grafana to enable you to use OSS tools more on Azure.
The new plugin allows you to display any data available in Log Analytics, such as logs related to virtual machine performance, security, Azure Active Directory which has recently integrated with Log Analytics, and many other log types including custom logs.
How can I use it?
The new plugin requires Grafana version 5.3 or newer. After the initial data source configuration, you can start embedding Azure Monitor logs in your dashboards and panels easily, simply select the service Azure Log Analytics and your workspace, then provide a query. You can reuse any existing queries you already have in Azure or write a new query. Writing queries in Grafana is made simple with the familiar IntelliSense auto-complete options you’ve already seen in the Azure Log Analytics query editor.
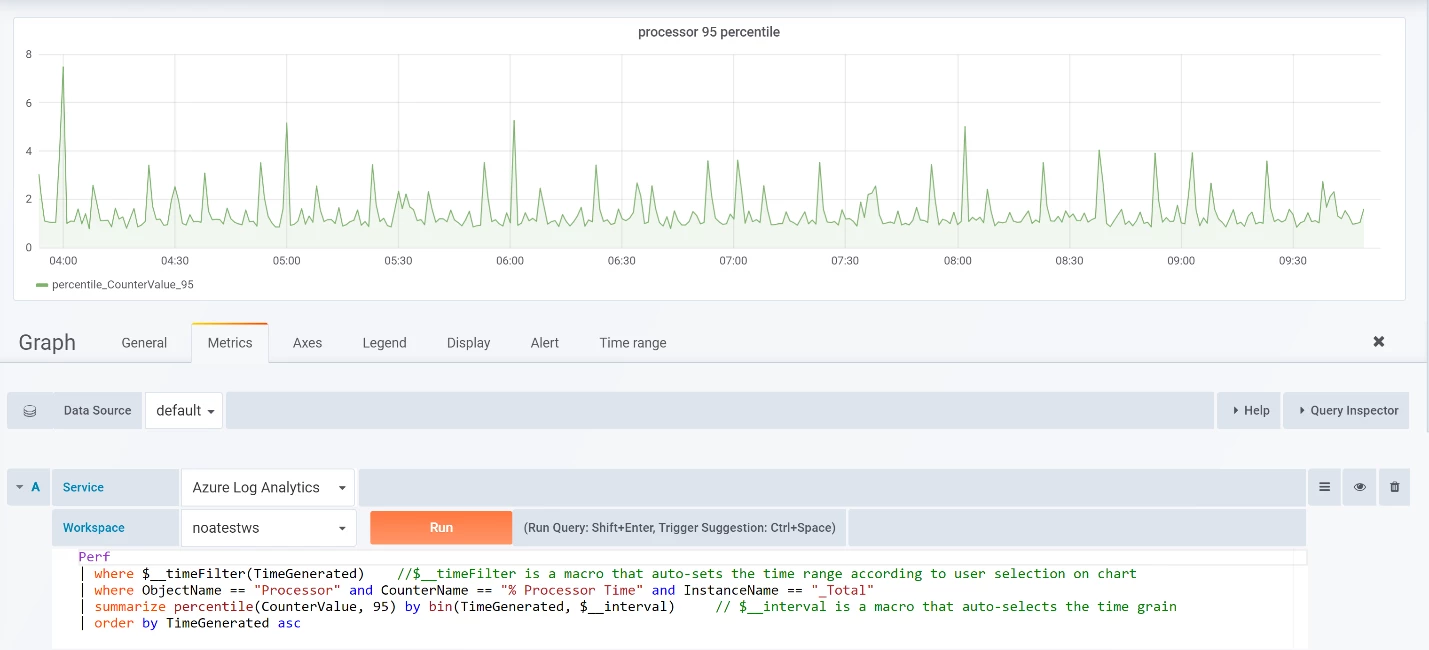
The plugin will run the query through the Log Analytics API, which means data is available to query as soon as it’s ingested to Log Analytics and is not copied to a separate store. In addition to the standard query language, Grafana supports specific macros such a $__timeFilter, which enables features like zooming-in on charts or using variables.
Added value
Grafana offers great dashboarding capabilities, rich visualizations, and integrations with over 40 data sources. If you’re already using Grafana for your dashboards, this new plugin can help you create a single pane of glass for your various monitoring needs. In result, covering both Azure metrics data as well as logs data.
Additionally, the plugin utilizes the powerful query language so you can do a lot more than display raw data.
- Calculate data that’s meaningful, such as your resources’ 95th percentile versus your SLA.
- Combine data from multiple workspaces and even from Application Insights using cross-workspace and cross-app queries.
- Correlate data with joins.
- Apply machine learning algorithms. The query language offers operators that perform smart analytics, so you can run advanced analytics, such as detect service disruptions based on trace logs or run a cohort analysis.
To learn more about the Grafana Azure Log Analytics plugin review the documentation, “Monitor your Azure services in Grafana.”