At Ignite we announced the public preview of Azure Monitor for VMs, a new capability that provides an in-depth view of VM health, performance trends, and dependencies. You can access Azure Monitor for VMs from the Azure VM resource blade to view details about a single VM, from Azure Monitor to understand compute issues at scale, and from the Resource Group blade to understand whether all the VMs in a common deployment are behaving as you expect.
Azure Monitor for VMs brings together key monitoring data about your Windows and Linux VMs, allowing you to:
- Monitor the health and availability of VMs, with customizable alert thresholds
- Troubleshoot guest-level performance issues and understand trends in VM resource utilization
- Determine whether back-end VM dependencies are connected properly, and which clients of a VM may be affected by any issues the VM is having
- Discover VM hotspots at scale based on resource utilization, connection metrics, health signals and alerts
Health
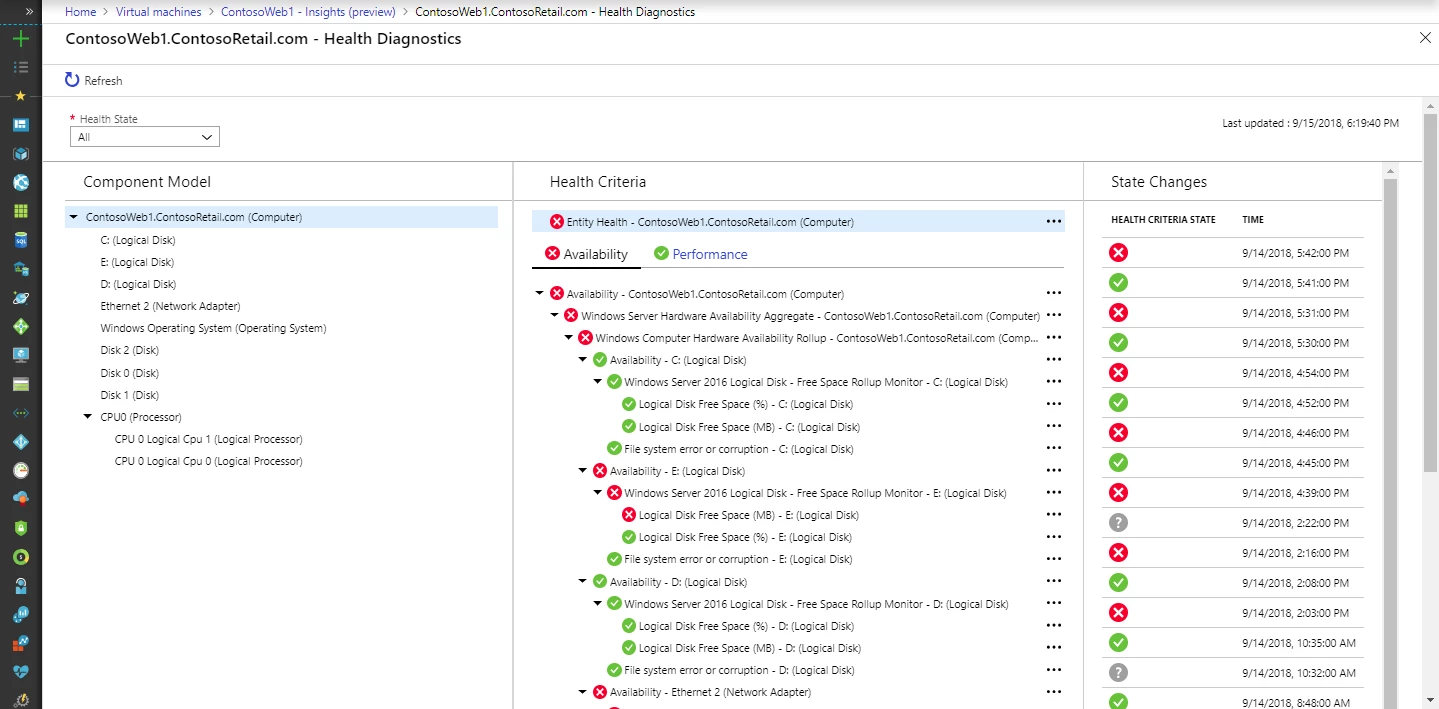
Health capabilities in Azure Monitor for VMs include out of the box configurable VM Health criteria that are powered by the same health modeling services used internally across Microsoft.
Health gives you powerful views to VM availability signals, including how many VMs are in a critical or warning state (or not able to connect to the monitoring service), which VMs by OS or resource type are reporting health issues, and details on health problems with CPU, disk, memory, and network adapters. You can quickly and proactively identify the top issues with VMs, configure near-real time alerts on health conditions, and link to Knowledge Base articles to remediate issues.
Maps
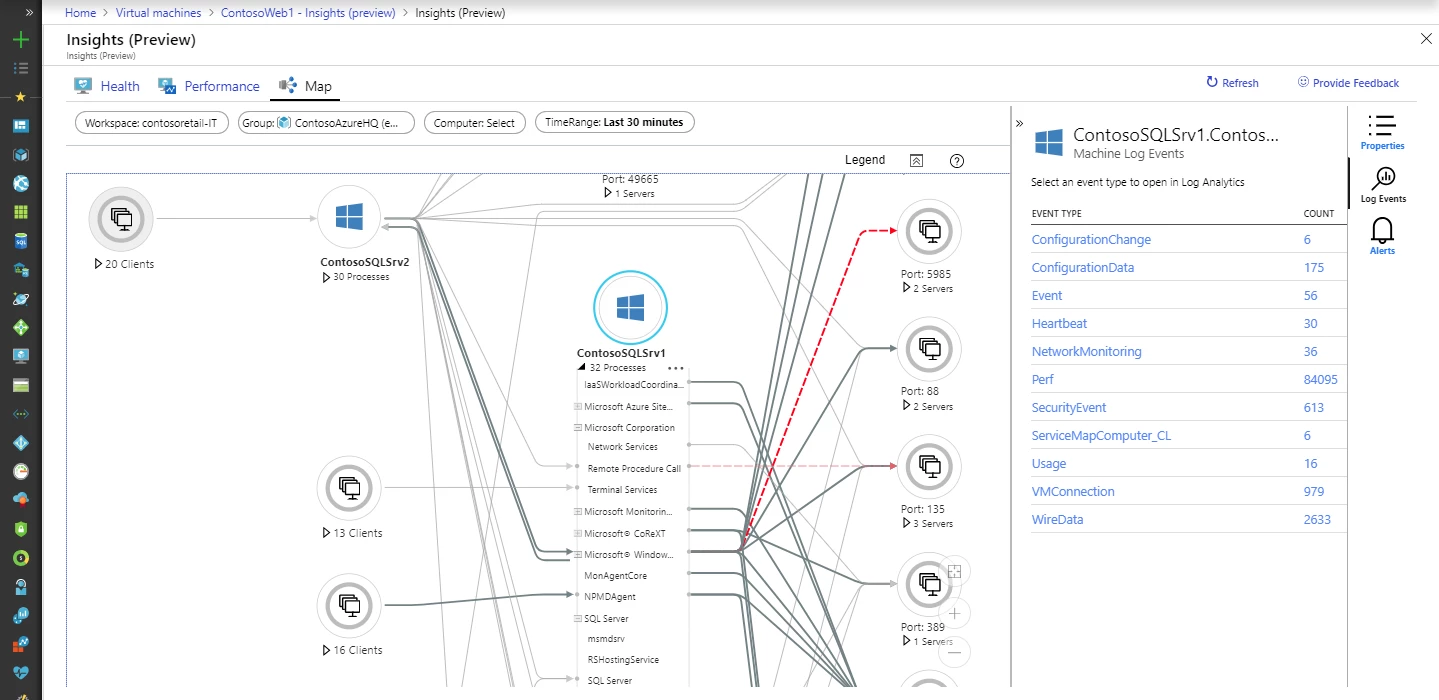
Azure Monitor for VMs includes dependency maps powered by the existing OMS Service Map solution and its Azure VM extension. Maps deliver a new Azure-centric user experience, with VM resource blade integration, Azure metadata, and dependency maps for Resource Groups and Subscriptions. Maps automatically show you how VMs and processes are interacting, identify surprise dependencies to third party services, and monitor connection failures, live connection counts, network bytes sent and received by process, and service-level latency.
In addition to the visual experience and group-level mapping in the user experience, you can now query VMConnection events in Log Analytics to alert on spikes in network traffic from selected workloads, query at scale for failed dependencies, and plan Azure migrations from on-prem VMs by analyzing connections over weeks or months.
The Service Map solution itself is not deprecated. Over time we expect to migrate users away from the existing OMS-based user experience and into the richer, integrated experiences of Azure Monitor.
Performance
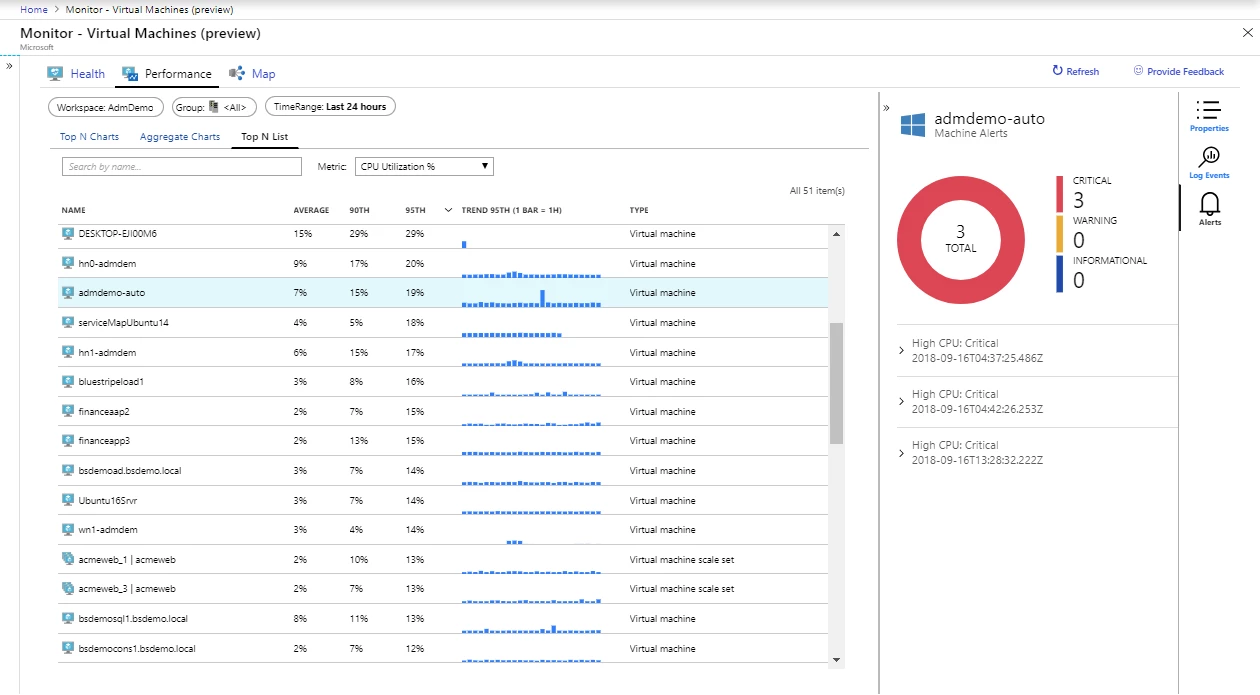
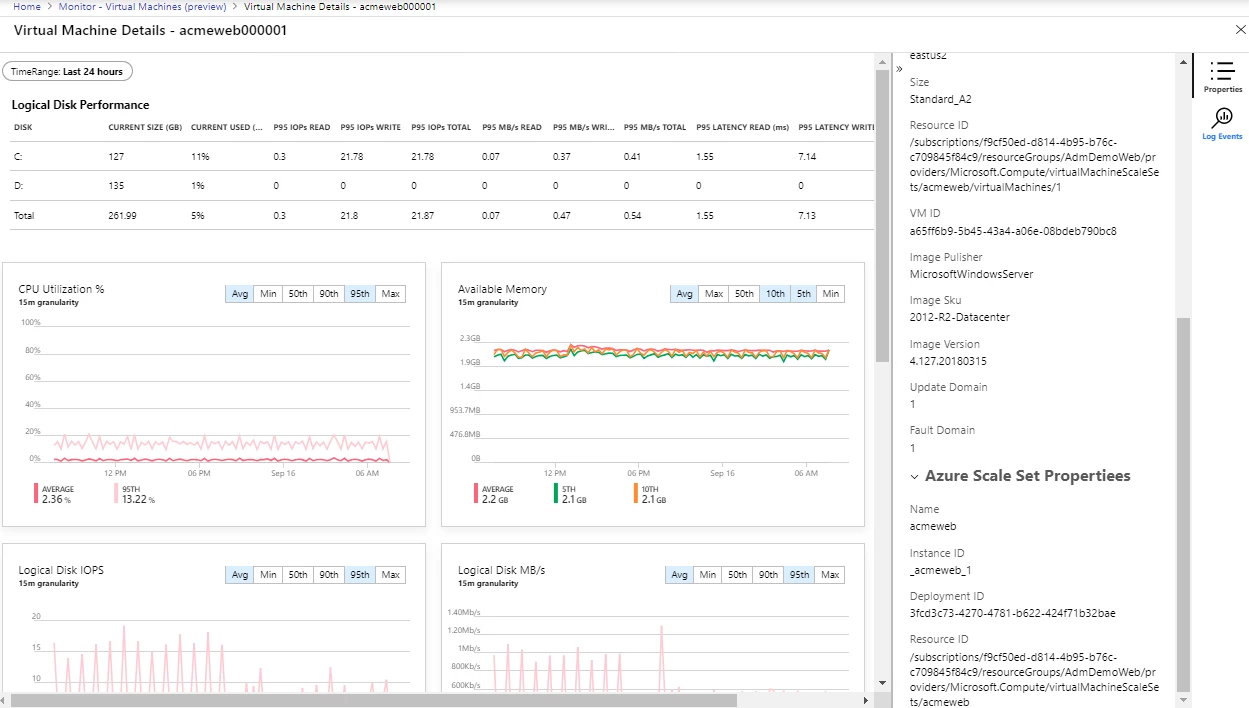
Performance views are powered by Log Analytics, and offer powerful aggregation and filtering capabilities including “Top N” VM sorting and searching across subscriptions and regions, aggregation of VM metrics (e.g. average memory ) across all VMs in a resource group across regions, percentiles of performance values over time, and breakdown and selection of VM Scale Set instances.
If you’ve had challenges isolating which of your thousands of VMs are resource constrained, quickly troubleshooting logical disk or memory consumption issues, or getting performance diagnostics where and when you need it while performing administration on your VMs, we’d love to get your feedback on these new Performance experiences.
Getting started
If you’re running VMs in an on-prem or hybrid environment, or using Azure VM Scale Sets, you can use the Performance and Map capabilities from the “Virtual Machines (preview)” menu of Azure Monitor to find resource constraints and visualize dependencies. The Health capability currently supports Azure VMs, and will be extended in the future to support other resource types. For the full list of supported OSes, please see our documentation page.
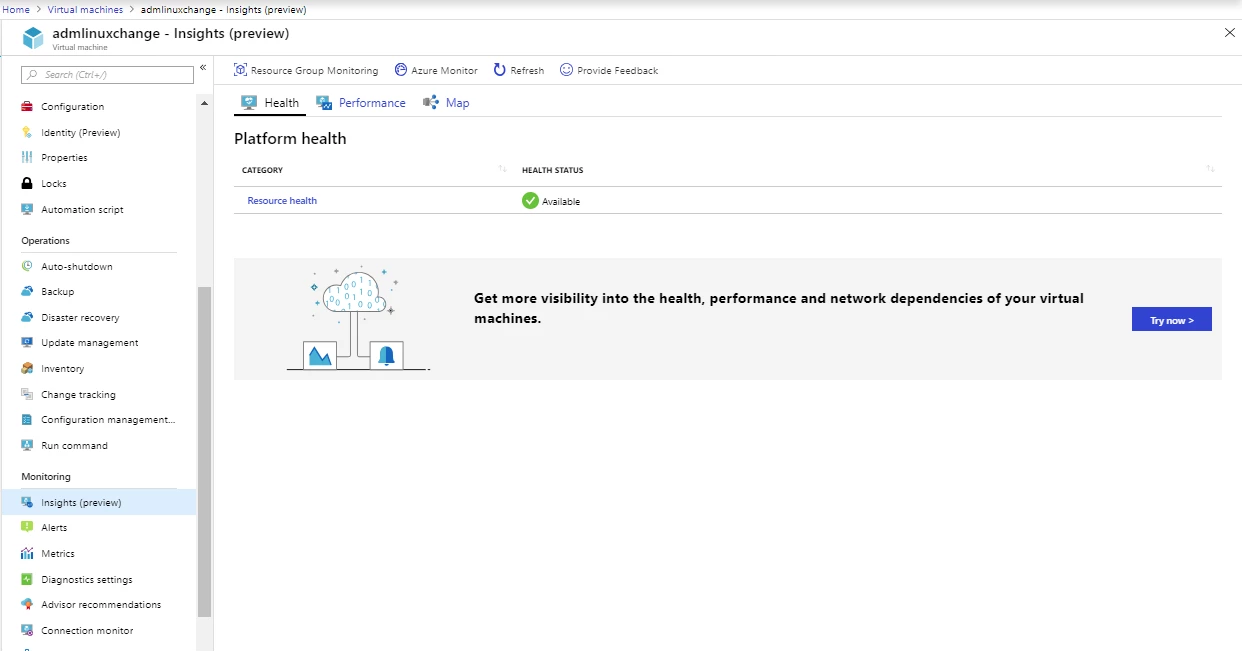
To get started, go to the resource blade for your VM and click on “Insights (preview)” in the Monitoring section. When you click “Try now”, you’ll be prompted to choose a Log Analytics workspace, or we can generate one for you. Once you’re comfortable with the capabilities on a few VMs, you can view VMs at scale in Azure Monitor under “Virtual Machines (preview)”, and on-board to entire resource groups and subscriptions using Azure Policy or using Powershell.
Check out our full documentation to get more details. We’d love to hear what you like and don’t like about Azure Monitor for VMs, and where you’d like us to take it. Please click “Provide Feedback” in the user experience to share your thoughts with us.