
One of the biggest topics of discussion at COP26, the global climate conference held in November 2021, was how a lack of reliable and consistent measurement hampers progress on the path to Net Zero. I have been reflecting on this issue and, on this Earth Day, I would like to provide an update on how we are measuring energy and water use at our datacenters to improve sustainability across the Azure Cloud.
Today, we’re sharing an important update on how Microsoft, and our datacenters, are helping to solve our part of this measurement challenge.
While the environmental goals are similar, each industry has unique challenges in measuring its carbon emissions to build its sustainability strategy. It’s one of the key reasons we, together with ClimateWorks Foundation and 20 other leading organizations, launched the Carbon Call. It’s also why we developed Microsoft Cloud for Sustainability, an Azure-based platform that allows organizations to combine disparate data sources into one place and help provide insights into how to improve their sustainability approaches.
You’ve told us just how important measuring energy and water consumption from our datacenters is in taking sustainability into account for commercial decisions. Below you will see, for the first time, our datacenter PUE (Power Usage Effectiveness) and WUE (Water Usage Effectiveness) metrics. To address these capabilities, we set design goals—our theoretical estimates of the most efficient we can operate our datacenters—and ensure we have measurements of our actual efficiencies. These targets can vary between datacenter generations and usage; for instance, newer datacenter generations as well as datacenters operating at peak utilization are more efficient. We track these statistics at a global level and by our operating geographies—Americas, Asia Pacific, and EMEA (Europe, Middle East, Africa).
Understanding Power Usage Effectiveness (PUE)
PUE is an industry metric that measures how efficiently a datacenter consumes and uses the energy that powers the datacenter, including the operation of systems like powering, cooling, and operating the servers, data networks and lights. The closer the PUE number is to “1,” the more efficient the use of energy.
While local environment and infrastructure can affect how PUE is calculated, there are also slight variations across providers. Here’s the simplest way to think about PUE.

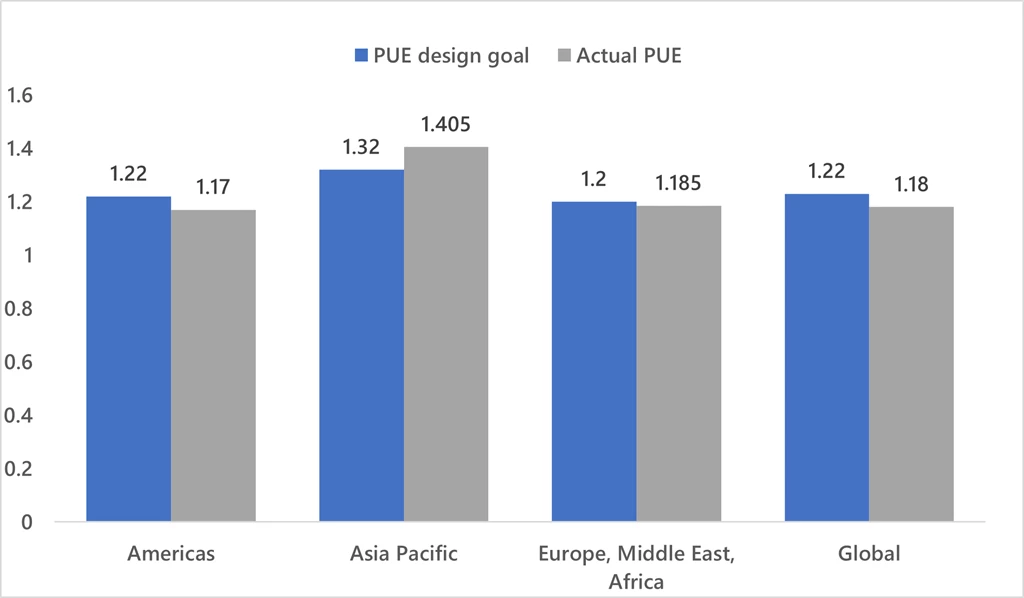
We design and build our datacenters toward the optimum PUE figure. We can also predict, with a high degree of accuracy, that optimum PUE figure. As we constantly innovate, we factor these changes into our datacenter designs to get as close to “1” as feasible. Our newest generation of datacenters have a design PUE of 1.12 and, with each new generation, we strive to become even more efficient. In the chart below, the blue bars show our estimated, or designed, PUE figures, while the grey bars indicate our actual PUE figures. As you can see, in Asia Pacific our actual PUE is higher; that’s due in part to higher ambient temperatures in the region which necessitates additional cooling.
In almost every region, our actual operating PUE is more efficient than our designs.
Understanding Water Usage Effectiveness (WUE)
Water Usage Effectiveness (WUE) is another key metric relating to the efficient and sustainable operations of our datacenters and is a crucial aspect as we work towards our commitment to be water positive by 2030.
WUE is calculated by dividing the number of liters of water used for humidification and cooling by the total annual amount of power (measured in kWh) needed to operate our datacenter IT equipment.

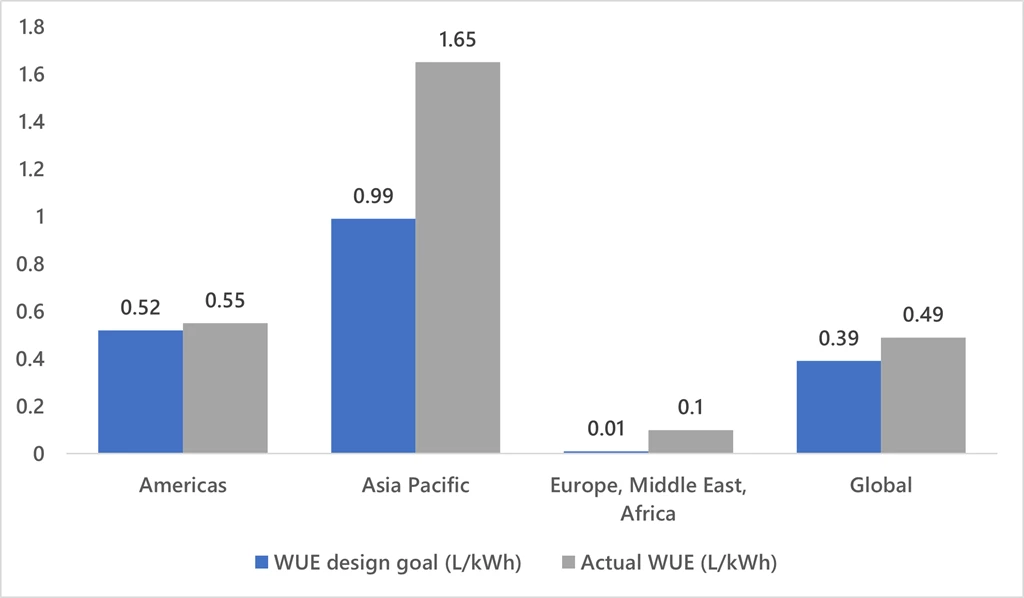
Like PUE, there are variables that can impact WUE—many of which relate to the location of the datacenter. Humid locations often have more atmospheric water, while arid locations have very little. Datacenters in colder parts of the world, like Sweden and Finland operate in naturally cooler environments so require less water for cooling. Our datacenter designs minimize water use. The chart below shows (in blue) our estimated or designed WUE figure, and in grey, our actual WUE figure. Again, Asia Pacific is higher due to higher ambient temperatures and as a result the need in some places for water-cooled chillers.
We continue to integrate our standards in water reduction technologies such as those in our Phoenix, Arizona datacenter where we use direct outside air most of the year to cool servers. We otherwise cool through direct evaporation that requires a fraction of the water compared to other, conventional water-based cooling systems such as water-cooled chillers.
Furthermore, by powering our datacenter with power from the Sun Streams 2 Solar Project owned by local partner, Longroad Energy, we’re displacing the water needed in the traditional electricity generation process and expect to save 356 million liters of water annually.
Scope 3 and supply chain
As we shared in March with our annual sustainability report, we made good progress on a number of our goals. Across the company’s operations, we saw an overall reduction in our Scope 1 and Scope 2 emissions of about 17 percent year over year, through our purchasing of renewable energy. At the same time, we also saw a rise in our Scope 3 emissions, which increased about 23 percent year over year.
We know that Scope 3 emissions (representing the total emissions across a company’s entire value chain) are the most difficult to control and reduce, because we can often only influence change. We know this is a long-term effort and this year we have increased our focus on operational discipline that is rooted in reliable data. We’ve also been working with partners across the industry, including Infrastructure Masons on carbon transparency within the datacenter supply chain, and will have exciting news to share at the Datacloud Global Congress on April 25 to 27.
Learn more
We know just how crucial data transparency and consistency are in helping our customers make the correct choices for their business, and hope that today’s announcement on our PUE and WUE data will be an important step forward in informing decisions about their sustainability strategies.
To learn more about our datacenter operations and commitments in action today, you can visit:


