Skip to main content Explore View all products (200+) Microsoft Foundry Azure Copilot GitHub Copilot Azure Kubernetes Service (AKS) Azure Cosmos DB Azure Database for PostgreSQL Azure Arc Microsoft Fabric Linux virtual machines in Azure Foundry Models Foundry Agent Service Foundry IQ Foundry Tools Foundry Control Plane Observability in Foundry Control Plane Azure OpenAI in Foundry Models Azure Speech in Foundry Tools Azure Machine Learning View all databases Azure Cosmos DB Azure DocumentDB Azure SQL Azure Database for PostgreSQL Azure Managed Redis Microsoft Fabric Azure Databricks Linux virtual machines in Azure Windows Server on Azure Azure Functions Azure Virtual Machine Scale Sets Azure API Management Azure Container Apps Azure Kubernetes Service (AKS) Azure Kubernetes Fleet Manager Azure Container Registry Azure Red Hat OpenShift Azure Container Instances Azure Container Storage Azure Arc Azure Local Microsoft Defender for Cloud Azure Monitor Microsoft Sentinel Azure Migrate View all solutions (40+) Cloud solutions for small and medium businesses Cloud migration and modernization center Data analytics for AI Azure Databases AI apps and agents Microsoft Marketplace Microsoft Sovereign Cloud AI apps and agents Responsible AI with Azure AI Infrastructure Data analytics for AI Machine learning operations (MLOps) Low-code application development on Azure Integration Services Serverless computing DevOps Migration and modernization center .NET apps migration Databases on Azure Linux on Azure Oracle on Azure SAP on the Microsoft Cloud Adaptive cloud High-performance computing (HPC) Infrastructure as a service (IaaS) Resiliency Azure Essentials Frontier Accelerate for Azure FinOps on Azure Microsoft Marketplace Azure pricing overview Create an Azure account Free Azure services Flexible purchase options Pricing calculator FinOps on Azure Maximize ROI from AI Azure savings plans Azure reservations Azure Hybrid Benefit Virtual Machines Azure SQL Microsoft Foundry Microsoft Fabric Azure Kubernetes Service (AKS) Microsoft Defender for Cloud View more Software Development Companies Microsoft Marketplace Find a partner Resources for Azure partners Get started with Azure Customer stories Analyst reports, white papers, and e-books Videos Learn more about cloud computing Documentation Explore Azure portal Developer resources Quickstart templates Resources for startups Developer community Students Azure for partners Blog Events and Webinars Learn Support Contact Sales Get started with Azure Sign in

As part of our continued commitment to open source solutions, we are announcing the general availability of Azure Managed Grafana, a managed service that enables you to run Grafana natively within the Azure cloud platform. With Azure Managed Grafana, you can seamlessly and securely connect with and scale to businesses’ existing Azure services, enhancing observability and cloud management.

In addition to the features announced during preview, with general availability, we’re introducing new capabilities that include the latest Grafana v9.0 features with its improved alerting experience as well as zone redundancy (in preview) and API key support.

New connections and integrations with Azure services

With general availability, we are adding new integrations with Azure services, allowing you to realize the benefits of Grafana as efficiently and effectively as possible.

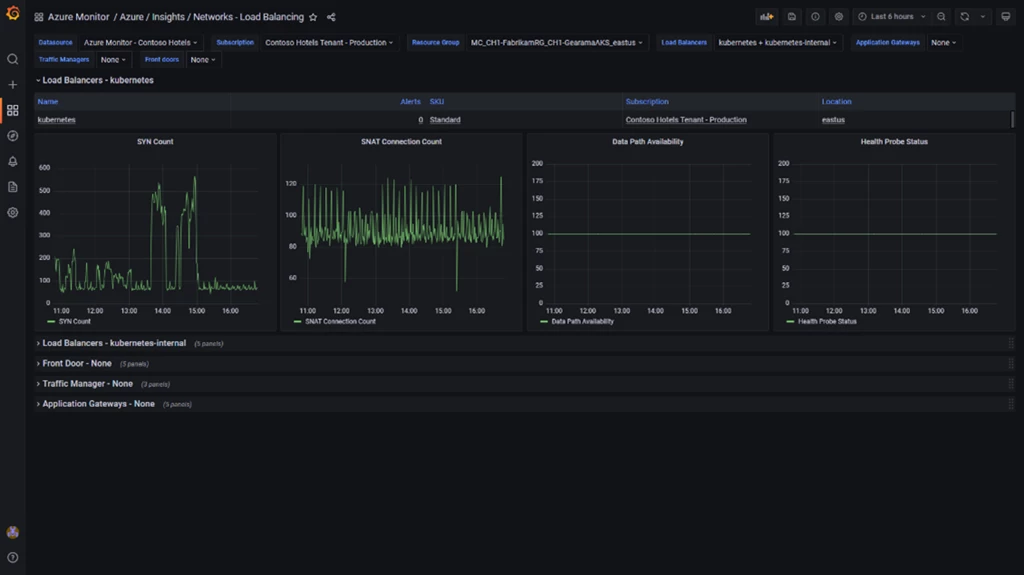
We have introduced several new out-of-the-box dashboards for Azure Monitor. For example, with Availability Tests Geo Map dashboard for Azure Monitor application insights, you can view the results and responsiveness of your application availability tests based on geographic location. Additionally, with the new out-of-the-box Load Balancing dashboard for Azure Monitor network insights, you can monitor key performance metrics for all your Azure load balancing resources, including Load Balancers, Application Gateway, Front Door, and Traffic Manager.
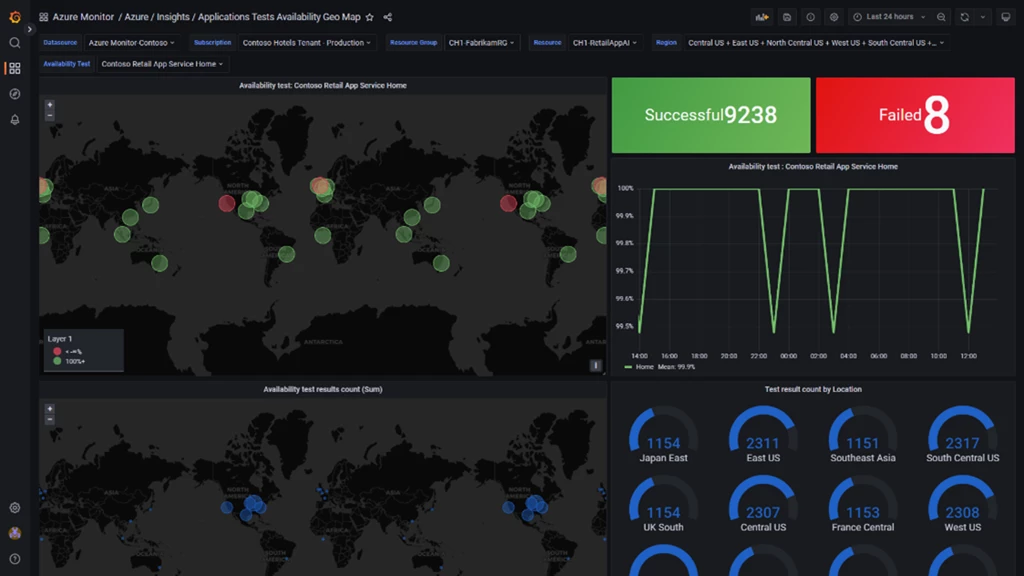
A dashboard on a black background. In the center-left is a world map with translucent red and green dots on it. On the far right are 2 graphs, one line graph and another semi circular one.
A dashboard on a black background. There are 4 line graphs (in green) across the center of the page.

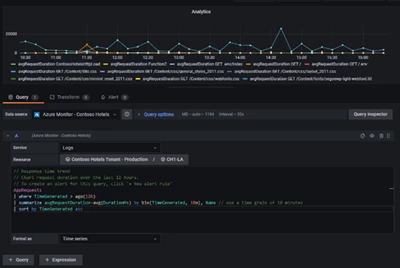
The new “pin to Grafana” feature for Azure Monitor Logs allows you to seamlessly add charts and queries from Azure Monitor Logs to Grafana dashboards with just one click. In the illustration below, you can see how the Azure Monitor Logs query on the left is replicated in the Grafana interface on the right.
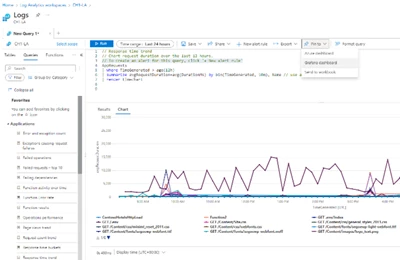
179391_image 4a
179391_image 4b

Similarly, we have introduced new out-of-the-box dashboards for Azure Container Apps as well. The new Aggregate View dashboard for Azure Container Apps depicts a geographic map of your container apps filtered by resource group, environment, and region with drill-down links to a detailed dashboard for each app. The new App View dashboard for Azure Container Apps monitors the performance of Azure Container Apps by viewing the key metrics of CPU, memory, restarts, and network traffic or by revision, replica, and status code.
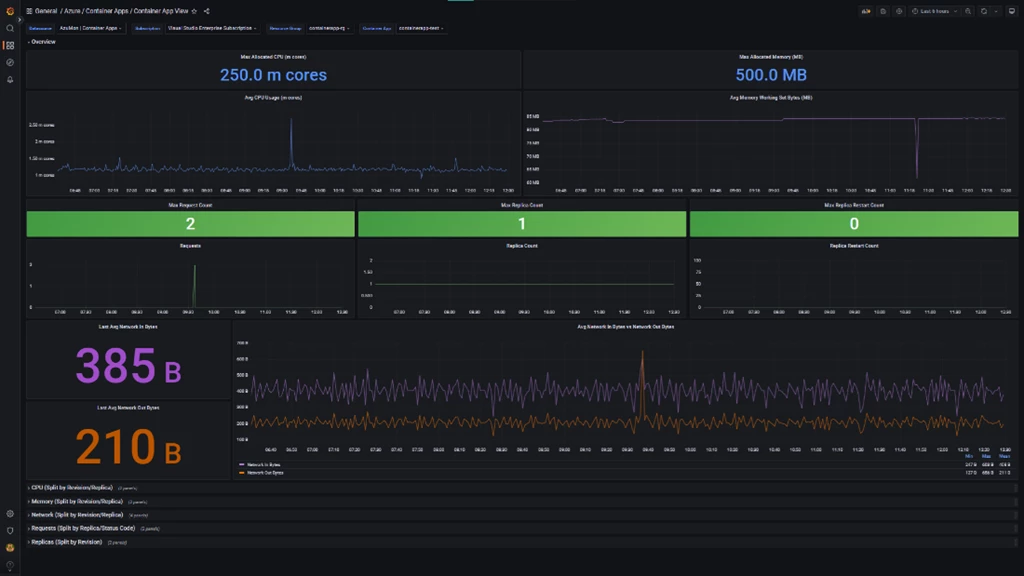
A dashboard on a black background. There are 6 line graphs in this view, all capturing different metrics of container app.

Read the Azure Managed Grafana technical community blog to learn more about the latest enhancements.

Get started with Azure Managed Grafana

Try it free for the first 30 days from the Azure portal today.

Go to the Azure Managed Grafana product page.

Read the technical documentation.

Share feedback on Microsoft Q&A.

WE ARE MICROSOFT

Explore Microsoft Foundry

The future of AI starts here. Envision your next great AI app with the latest technologies. Get started with Azure.