As part of our continued commitment to open source solutions, we are announcing the general availability of Azure Managed Grafana, a managed service that enables you to run Grafana natively within the Azure cloud platform. With Azure Managed Grafana, you can seamlessly and securely connect with and scale to businesses’ existing Azure services, enhancing observability and cloud management.
In addition to the features announced during preview, with general availability, we’re introducing new capabilities that include the latest Grafana v9.0 features with its improved alerting experience as well as zone redundancy (in preview) and API key support.
New connections and integrations with Azure services
With general availability, we are adding new integrations with Azure services, allowing you to realize the benefits of Grafana as efficiently and effectively as possible.
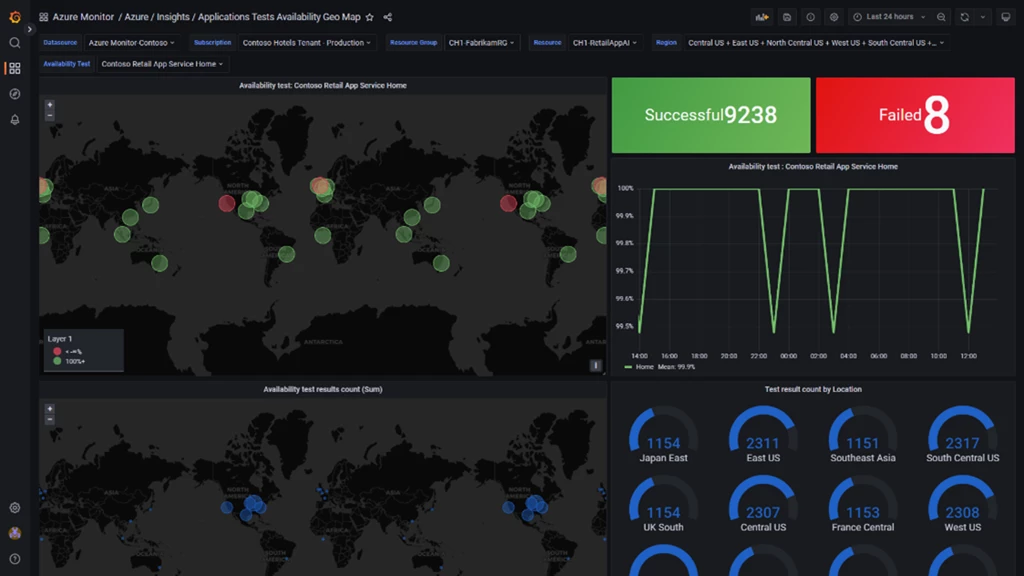
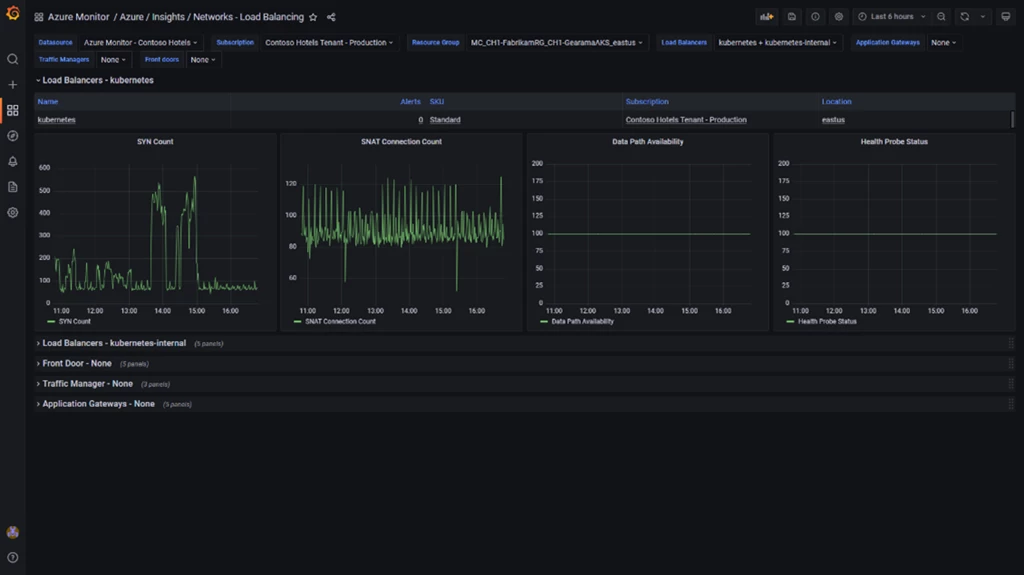
We have introduced several new out-of-the-box dashboards for Azure Monitor. For example, with Availability Tests Geo Map dashboard for Azure Monitor application insights, you can view the results and responsiveness of your application availability tests based on geographic location. Additionally, with the new out-of-the-box Load Balancing dashboard for Azure Monitor network insights, you can monitor key performance metrics for all your Azure load balancing resources, including Load Balancers, Application Gateway, Front Door, and Traffic Manager.
The new “pin to Grafana” feature for Azure Monitor Logs allows you to seamlessly add charts and queries from Azure Monitor Logs to Grafana dashboards with just one click. In the illustration below, you can see how the Azure Monitor Logs query on the left is replicated in the Grafana interface on the right.


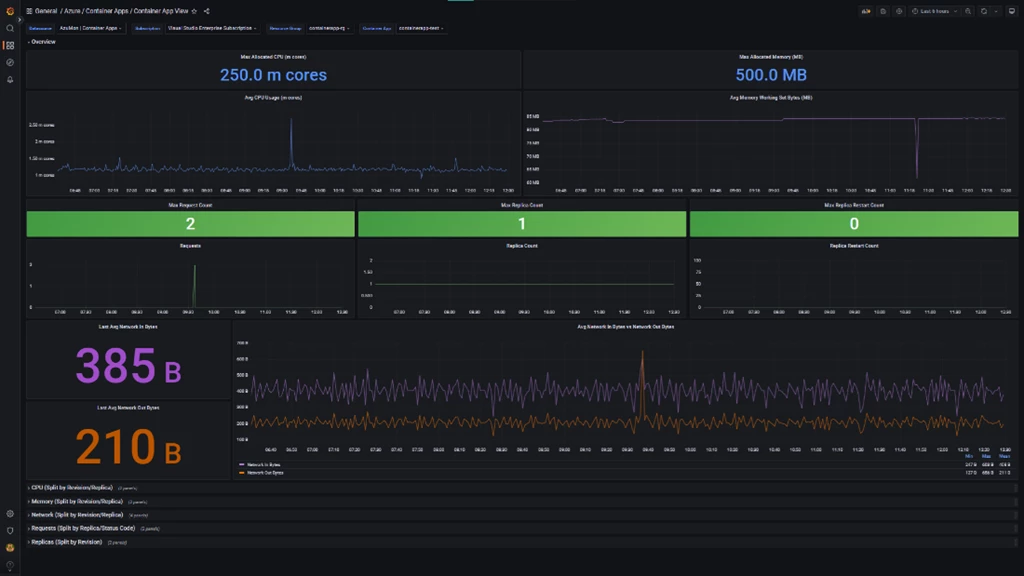
Similarly, we have introduced new out-of-the-box dashboards for Azure Container Apps as well. The new Aggregate View dashboard for Azure Container Apps depicts a geographic map of your container apps filtered by resource group, environment, and region with drill-down links to a detailed dashboard for each app. The new App View dashboard for Azure Container Apps monitors the performance of Azure Container Apps by viewing the key metrics of CPU, memory, restarts, and network traffic or by revision, replica, and status code.
Read the Azure Managed Grafana technical community blog to learn more about the latest enhancements.
Get started with Azure Managed Grafana
Try it free for the first 30 days from the Azure portal today.
Go to the Azure Managed Grafana product page.
Read the technical documentation.
Share feedback on Microsoft Q&A.