Today we are excited to announce the public preview of Azure Monitor, a new service making inbuilt monitoring available to all Azure users. This preview release builds on some of the monitoring capabilities that already exist for Azure resources. With Azure Monitor, you can consume metrics and logs within the portal and via APIs to gain more visibility into the state and performance of your resources. Azure Monitor provides you the ability to configure alert rules to get notified or to take automated actions on issues impacting your resources. Azure Monitor enables analytics, troubleshooting, and a unified dashboarding experience within the portal, in addition to enabling a wide range of product integrations via APIs and data export options. In this blog post, we will take a quick tour of Azure Monitor and discuss some of the product integrations.
Quick access to all monitoring tasks
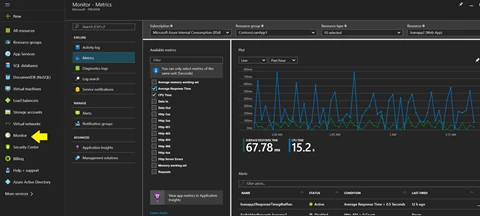
With Azure Monitor, you can explore and manage all your common monitoring tasks from a single place in the portal. To access Azure Monitor, click on the Monitor tab in the Azure portal. You can find Activity logs, metrics, diagnostics logs, and alert rules as well as quick links to the advanced monitoring and analytics tools. Azure Monitor provides these three types of data – Activity Log, Metrics, and Diagnostics Logs.
Activity Log
Operational issues are often caused by a change in the underlying resource. Activity Log keeps track of all the operations performed on your Azure resources. You can use the Activity Log section in the portal to quickly search and identify operations that may impact your application. Another valuable feature of the portal is the ability to pin Activity log queries on your dashboard to keep a tab on the operations you are interested in. For example, you can pin a query that filters Error level events and keep track of their count in the dashboard. You can also perform instant analytics on Activity Log via Log Analytics, part of Microsoft Operations Management Suite (OMS).
Metrics
With the new Metrics tab, you can browse all the available metrics for any resource and plot them on charts. When you find a metric that you are interested in, creating an alert rule is just a single click away. Most Azure services now provide out-of-the-box, platform-level metrics at 1-minute granularity and 30-day data retention, without the need for any diagnostics setup. The list of supported resources and metrics is available here. These metrics can be accessed via the new REST API for direct integration with 3rd party monitoring tools.
Diagnostics logs
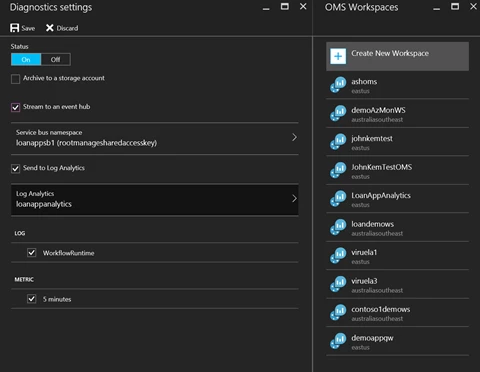
Many Azure services provide diagnostics logs, which contain rich information about operations and errors that are important for auditing as well as troubleshooting purposes. In the new Diagnostic logs tab, you can manage diagnostics configuration for your resources and select your preferred method of consuming this data.
Alerts & automated actions
Azure Monitor provides you the data to quickly troubleshoot issues. But you want to be proactive and fix issues before it impacts your customers. With Alert rules, you can get notified whenever a metric crosses a threshold. You can receive email notifications or kick off an Automation-runbook script or webhook to fix the issue automatically. You can also configure your own metrics using custom metrics and events APIs to send data to Azure Monitor pipeline and create alert rules on them. With the ability to create alerts rules on platform, custom and app-level metrics, you now have more control on your resources. You can learn more about alert rules here.
Single monitoring dashboard
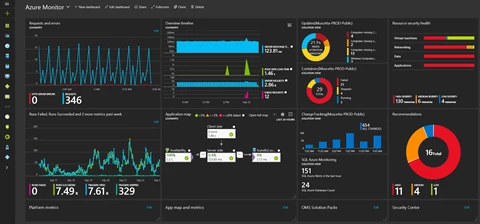
Azure provides you a unique single dashboard experience to visualize all your platform telemetry, application telemetry, analytics charts and security monitoring. You can share these dashboards with others on your team or clone a dashboard to build new ones.
Extensibility
The portal is a convenient way to get started with Azure Monitor. However, if you have a lot of Azure resources and want to automate the Azure Monitor setup you may want to use a Resource Manager template, PowerShell, CLI, or REST API. Also, if you want to manage access permissions to your monitoring settings and data look at the monitoring roles.
Product integrations
You may have the need to consume Azure Monitor data but want to analyze it in in your favorite monitoring tool. This is where the product integrations come into play – you can route the Azure Monitor data to the tool of your choice in near real-time. Azure Monitor enables you to easily stream metrics and diagnostic logs to OMS Log Analytics to perform custom log search and advanced alerting on the data across resources and subscriptions. Azure Monitor metrics and logs for Web Sites and VMs can be easily routed to Visual Studio Application Insights, unlocking deep application performance management within the Azure portal.
The product integrations go beyond what you see in the portal. Our partners bring additional monitoring experiences, which you may wish to take advantage of. We are excited to share that there is a growing list of partner services available on Azure to best serve your needs. Please visit the supported product integrations list and give us feedback.
To wrap up, Azure Monitor helps you bring together the monitoring data from all your Azure resources and combine it with the monitoring tool of your choice to get a holistic view of your application. Here is a snapshot of a sample dashboard that we use to monitor one of our applications running on Azure. We are excited to launch Azure Monitor and looking forward to the dashboards that you build. Review the Azure Monitor documentation to get started and please keep the feedback coming.