
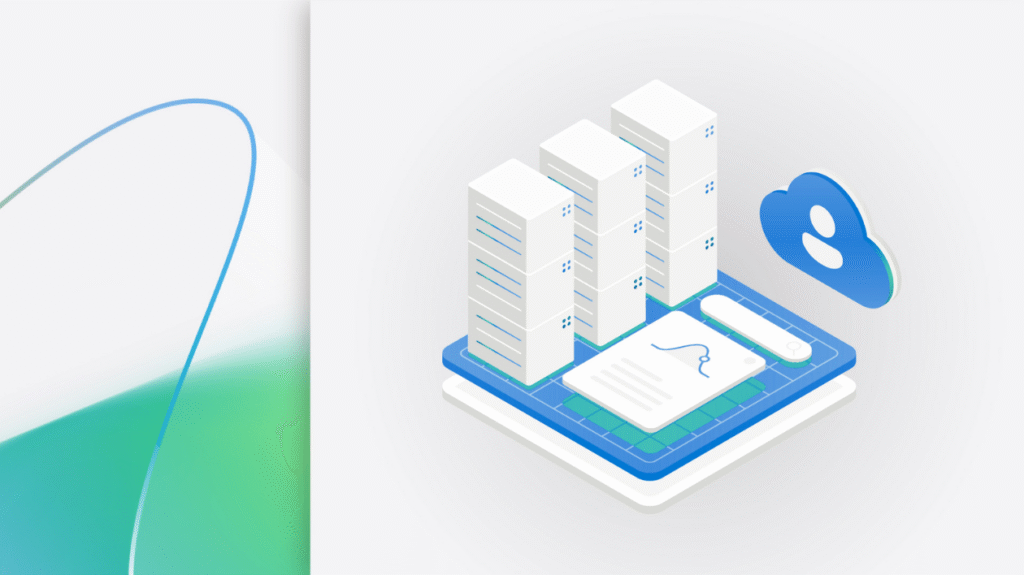
Introducing Azure Accelerate for Databases: Modernize your data for AI with experts and investments
Azure Accelerate for Databases helps organizations modernize their databases and build AI-ready capabilities.
Stay informed with the latest breakthroughs and innovations in cloud technology, directly from the experts at Microsoft Azure. Our announcements section is your go-to source for new features and pathways to empower your digital transformation.
Azure Accelerate for Databases helps organizations modernize their databases and build AI-ready capabilities.
By continuously optimizing data placement, smart tier ensures your storage costs are aligned with actual usage.

Microsoft is named a Leader in The Forrester Wave™ for Sovereign Cloud Platforms, recognizing Microsoft Sovereign Cloud leadership in evolving sovereignty needs.
Explore how Microsoft and Armada bring sovereign AI to the edge with Azure Local, enabling secure, resilient workloads in disconnected and regulated environments.

To break the infrastructure bottleneck and shift the industry from ambition to delivery, Microsoft is announcing an AI for nuclear collaboration with NVIDIA, to provide end-to-end tools that streamline permitting, accelerate design, and optimize operations across the industry.

We’re bring attendees together to share real experiences and solve challenges side-by-side. Only together can we move into meaningful results.

Microsoft combines accelerated computing with cloud scale engineering to bring advanced AI capabilities to our customers. For years, we’ve worked with NVIDIA to integrate hardware, software and infrastructure to power many of today’s most important AI breakthroughs.
We’re announcing the first agentic end-to-end modernization solution that brings IT and developers into a single, connected workflow.
We’re announcing the public preview of Fireworks AI on Microsoft Foundry, bringing high‑performance open model inference into Azure.

Today, we’re announcing OpenAI’s GPT‑5.4 to be generally available soon in Microsoft Foundry: a model designed to help organizations move from planning work to reliably completing it in production environments.
Enterprises today face a familiar yet formidable challenge: mountains of documents -contracts, invoices, reports, forms – remain locked in unstructured formats. Traditional OCR (optical character recognition) captures text, but often struggles with context, layout complexity, or multilingual content. The result?
Today, we’re excited to introduce instant access support for incremental snapshots of Premium SSD v2 (Pv2) and Ultra Disk, delivering an industry-leading snapshot experience where creation, disk restore, and production-ready performance all happen instantly.