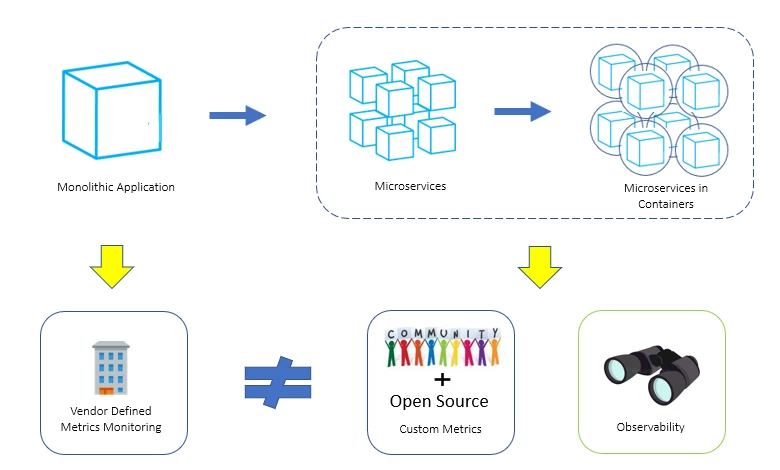
Over the past few years, we’ve seen significant changes in how an application is thought of and developed, especially with the adoption of containers and the move from traditional monolithic applications to microservices applications. This shift also affects how we think about modern application monitoring, now with greater adoption of open source technologies and the introduction of observability concepts.
In the past, vendors owned the application and infrastructure, and as a result, they knew what metrics to monitor. With open source products growing in number, vendors do not own all the metrics, and custom metrics are extremely necessary with current monitoring tools. Unlike the monolith application, which is a single deployment unit with a simple status of healthy or not, modern applications will consist of dozens of different microservices with fractional n-states. This is due to the sophisticated deployment strategies and rollbacks where customers may be running different versions of the same services in production, especially on Kubernetes. Thus, embracing these shifts is essential in monitoring.
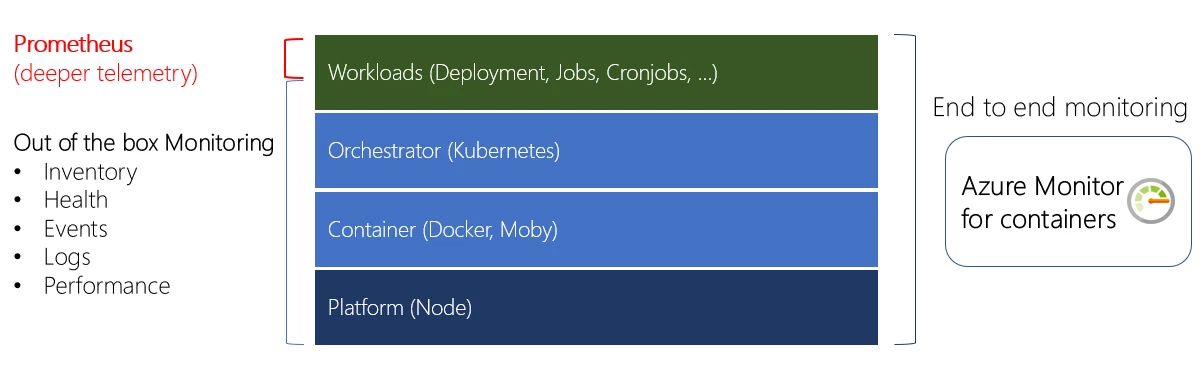
Custom metrics and open source technologies help improve the observability of specific components of your application, but you also need to monitor the full stack. Azure Monitor for containers embraces both observability through live data and collecting custom metrics using Prometheus, providing the full stack end-to-end monitoring from nodes to Kubernetes infrastructure to workloads.
Collecting Prometheus metrics and viewing using Grafana dashboards
By instrumenting Prometheus SDK into your workloads, Azure Monitor for containers can scrape the metrics exposed from Prometheus end-points so you can quickly gather failure rates, response per secs, and latency. You can use Prometheus to collect some of the Kubernetes infrastructure metrics that are not provided out of the box by Azure Monitor by configuring the containerized agent.
From Log Analytics, you can easily run a Kusto Query Language (KQL) query and create your custom dashboard in the Azure portal dashboard. For many customers using Grafana to support their dashboard requirements, you can visualize the container and Prometheus metrics in a Grafana dashboard.
Below is an example of a dashboard that provides an end-to-end Azure Kubernetes Service (AKS) cluster overview, node performances, Kubernetes infrastructure, and workloads.
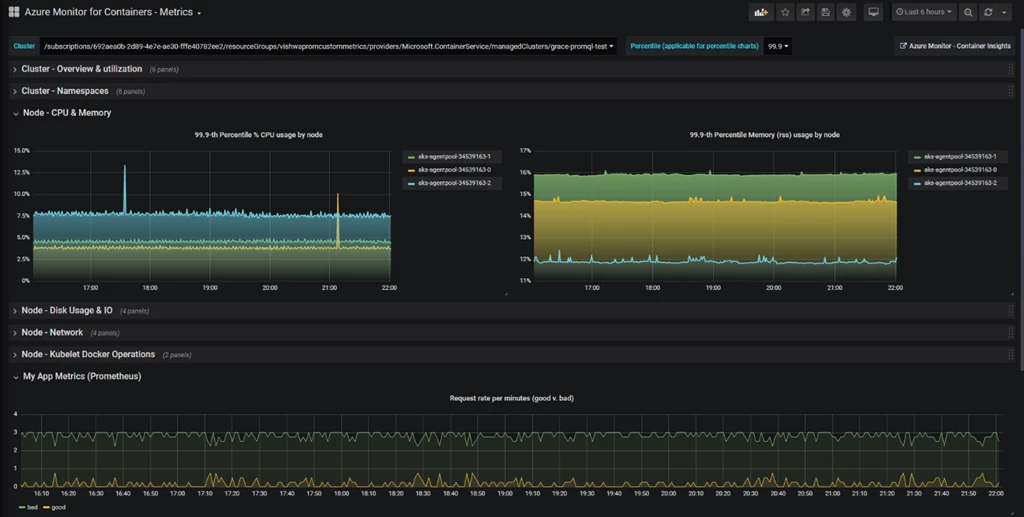
If you would like to monitor or troubleshoot other scenarios, such as list of all workload live sites, or noisy neighbor issues on a worker node, you can always switch to Azure Monitor for container to view the visualizations included from the Grafana dashboard by clicking on Azure Monitor – Container Insights in the top right-hand corner.

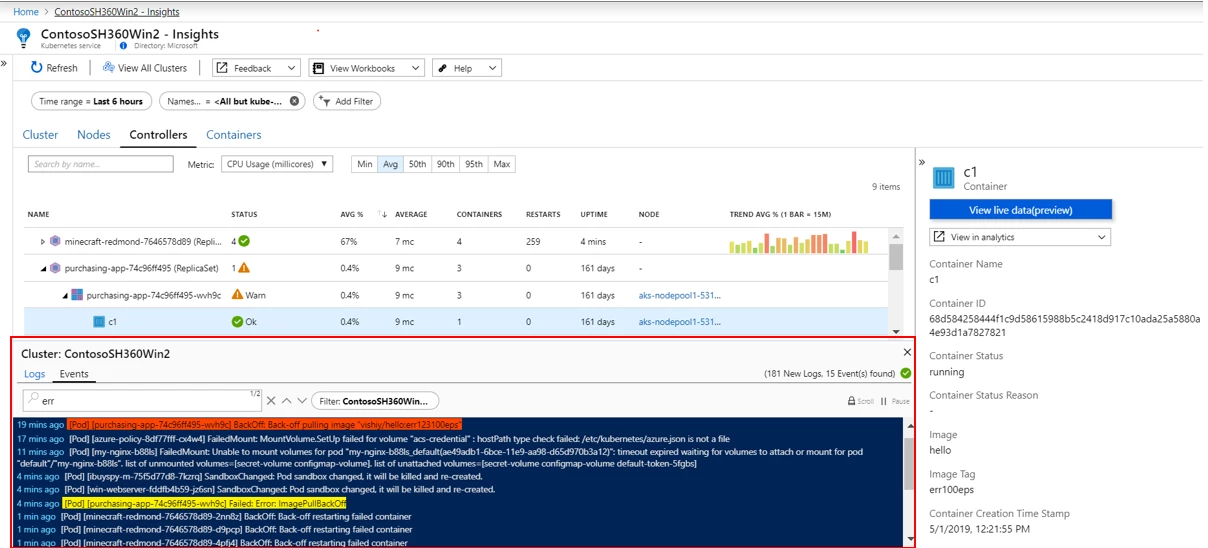
Azure Monitor for containers provides the live, real-time data of container logs and Kubernetes event logs to provide observability as seen above. You can see your deployments immediately and observe any anomalies using the live data.
If you are interested in trying Azure Monitor for containers, please check the documentation. Once you have enabled the monitoring, and if you would like to try the Grafana template, please go to the Grafana gallery. This template will light up using the out-of-the-box data collected from Azure Monitor for containers. If you want to add more charts to view other metrics collected, you can do so by checking our documentation.
Prometheus data collection and Grafana are also supported for AKS Engine as well.
For any feedback or suggestions, please reach out to us through Azure Community Support or Stack Overflow.