Prometheus is a popular open source metric monitoring solution and is a part of Cloud Native Compute Foundation. We have many customers who like the extensive metrics which Prometheus provides on Kubernetes. However, they also like how easy it is to use Azure Monitor for containers which provides fully managed, out of the box monitoring for Azure Kubernetes Service (AKS) clusters. We have been receiving requests to funnel the Prometheus data into Azure Monitor and today, we are excited to share Prometheus integration with Azure Monitor for containers is now in preview and brings together the best of two worlds.
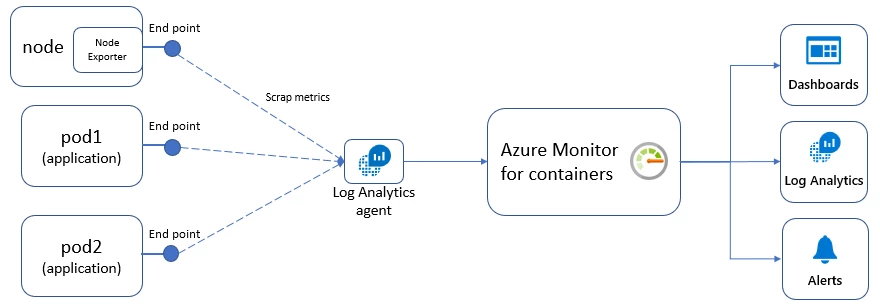
Typically, to use Prometheus you need to setup and manage a Prometheus server with a database. With the Azure Monitor integration, no Prometheus server is needed. You just need to expose the Prometheus end-point through your exporters or pods (application), and the containerized agent for Azure Monitor for containers can scrape the metrics for you. We have provided a seamless onboarding experience to collect Prometheus metrics with Azure Monitor. The example below shows how the coredns metrics, which is part of the kube-dns-metric, is collected into Azure Monitor for logs.

You can also collect workload metrics from your containers by instrumenting Prometheus SDK into your application. The example below shows the collection of the prommetrics_demo_requests_counter. You can collect workload metrics through URL, endpoints, or pod annotation as well.

Full stack monitoring with Azure Monitor for containers
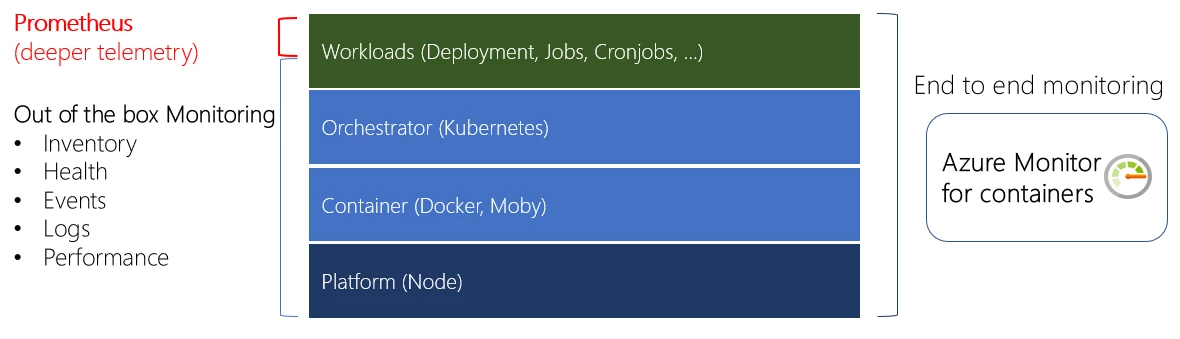
So how does Prometheus metrics fit in with the rest of the metrics including the recently added storage and network performance metrics that Azure Monitor for containers already provides. You can see how the metrics all fit together below. Azure Monitor for containers provides out of the box telemetry at the platform, container, orchestrator level, and to an extent the workload level. With the additional workload metrics from Prometheus you now get full stack, end to end monitoring view for your Azure Kubernetes Services (AKS) in Azure Monitor for containers.
Visualizing Prometheus metrics on Azure dashboard and alerting
Once the metrics are stored in Azure Monitor logs, you can query against the metrics using Log Analytics with Kusto Query Language (KQL). Here’s a sample query that instruments the Prometheus SDK. You can quickly plot the result using queries in the Azure portal.
InsightsMetrics
| where Name == "prommetrics_demo_requests_counter_total"
| extend dimensions=parse_json(Tags)
| extend request_status = tostring(dimensions.request_status)
| where request_status == "bad"
| where TimeGenerated > todatetime('2019-07-02T09:40:00.000')
| where TimeGenerated < todatetime('2019-07-02T09:54:00.000')
| project request_status, Val, TimeGenerated | render timechart
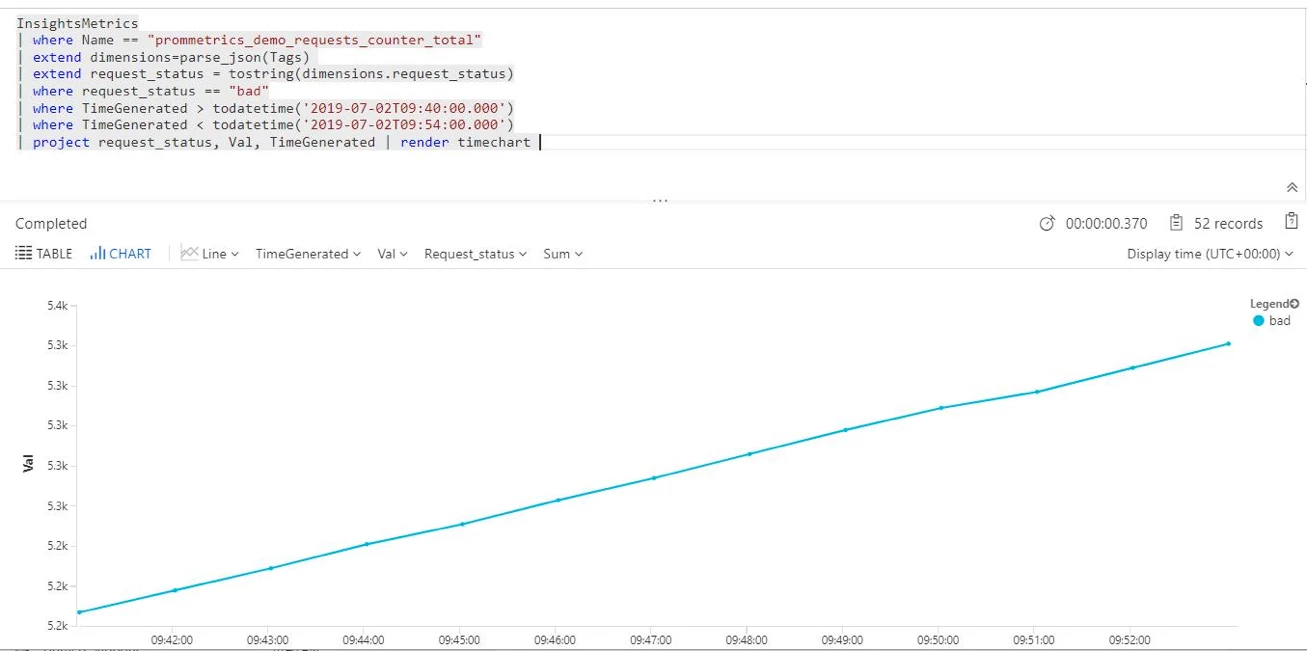
You can pin the chart to your Azure dashboard and create your own customized dashboard. You can also pin your current pod and node charts to the dashboard from the Azure Monitor for container cluster view.

If you would like to alert against the Prometheus metrics, you can do so using alerts in Azure.
This has been an exciting integration for us, and we are looking to continue our effort to help our customers on monitoring Kubernetes. For more information on configuring the agent to collect Prometheus data, querying, and using the data on Azure Monitor for containers, visit our documentation. Prometheus provides rich and extensive telemetry, if you need to understand the cost implications here’s a query which will show you the data ingested from Prometheus into Azure Monitor logs.
For available metrics on Prometheus, please go to Prometheus website.
For any feedback or suggestions, please reach out to us through the techforum or stackoverflow.