Today, we are announcing the integration of New Relic One performance monitoring in Azure Spring Cloud.
Over the past 18 months, we worked with many enterprise customers to learn about their scenarios. Many of these customers have thousands of Spring Boot applications running in on-premises data centers. As they migrate these applications to the cloud, they need to instrument them for application performance monitoring (APM) using tools that their developers are familiar with, and have been using for years, and they must ensure continuity for desktop and mobile applications which are already pre-instrumented for end-to-end monitoring using agents like New Relic One. With the integration of New Relic One in Azure Spring Cloud, you can continue your journey and easily instrument your Spring Boot applications with New Relic One.
Most organizations that deploy Spring Boot applications today share a similar goal: maximize the benefits of running Spring Boot applications at virtually any scale, using automation and application performance monitoring. While Azure Spring Cloud excels at abstracting away much of the toil associated with managing containerized workloads, the challenge of monitoring and maintaining the performance and health of these applications, or of troubleshooting issues when they occur, can be daunting—especially as organizations deploy these applications at massive scale. To help you succeed and continue your New Relic One journey, we integrated and upgraded your ability to instrument, monitor, and deliver observability using New Relic One across your Azure Spring Cloud instances. That begins with setting up instrumentation quickly and easily. Then you can analyze the performance and health of your applications, Java Virtual Machines (JVM), transactions, and more to identify and troubleshoot performance issues.
Instrument your Spring Boot applications
Run a “provisioning” automation for a completely hands-off experience for instrumenting and monitoring any new applications that you create and deploy—using Terraform or ARM Template. Or you can run it on-demand using the Azure CLI for greater flexibility and control.
az spring-cloud app update --name customers-service
    --jvm-options="-javaagent:/opt/agents/newrelic/java/newrelic-agent.jar"
    --env NEW_RELIC_APP_NAME=customers-service NEW_RELIC_LICENSE_KEY=
Explore Spring Boot application performance
After instrumenting, you can explore Spring Boot application performance through the New Relic One portal. You can view your applications in action through the Service Maps. For example, the screenshot below shows all the applications in the popular Petclinic project:
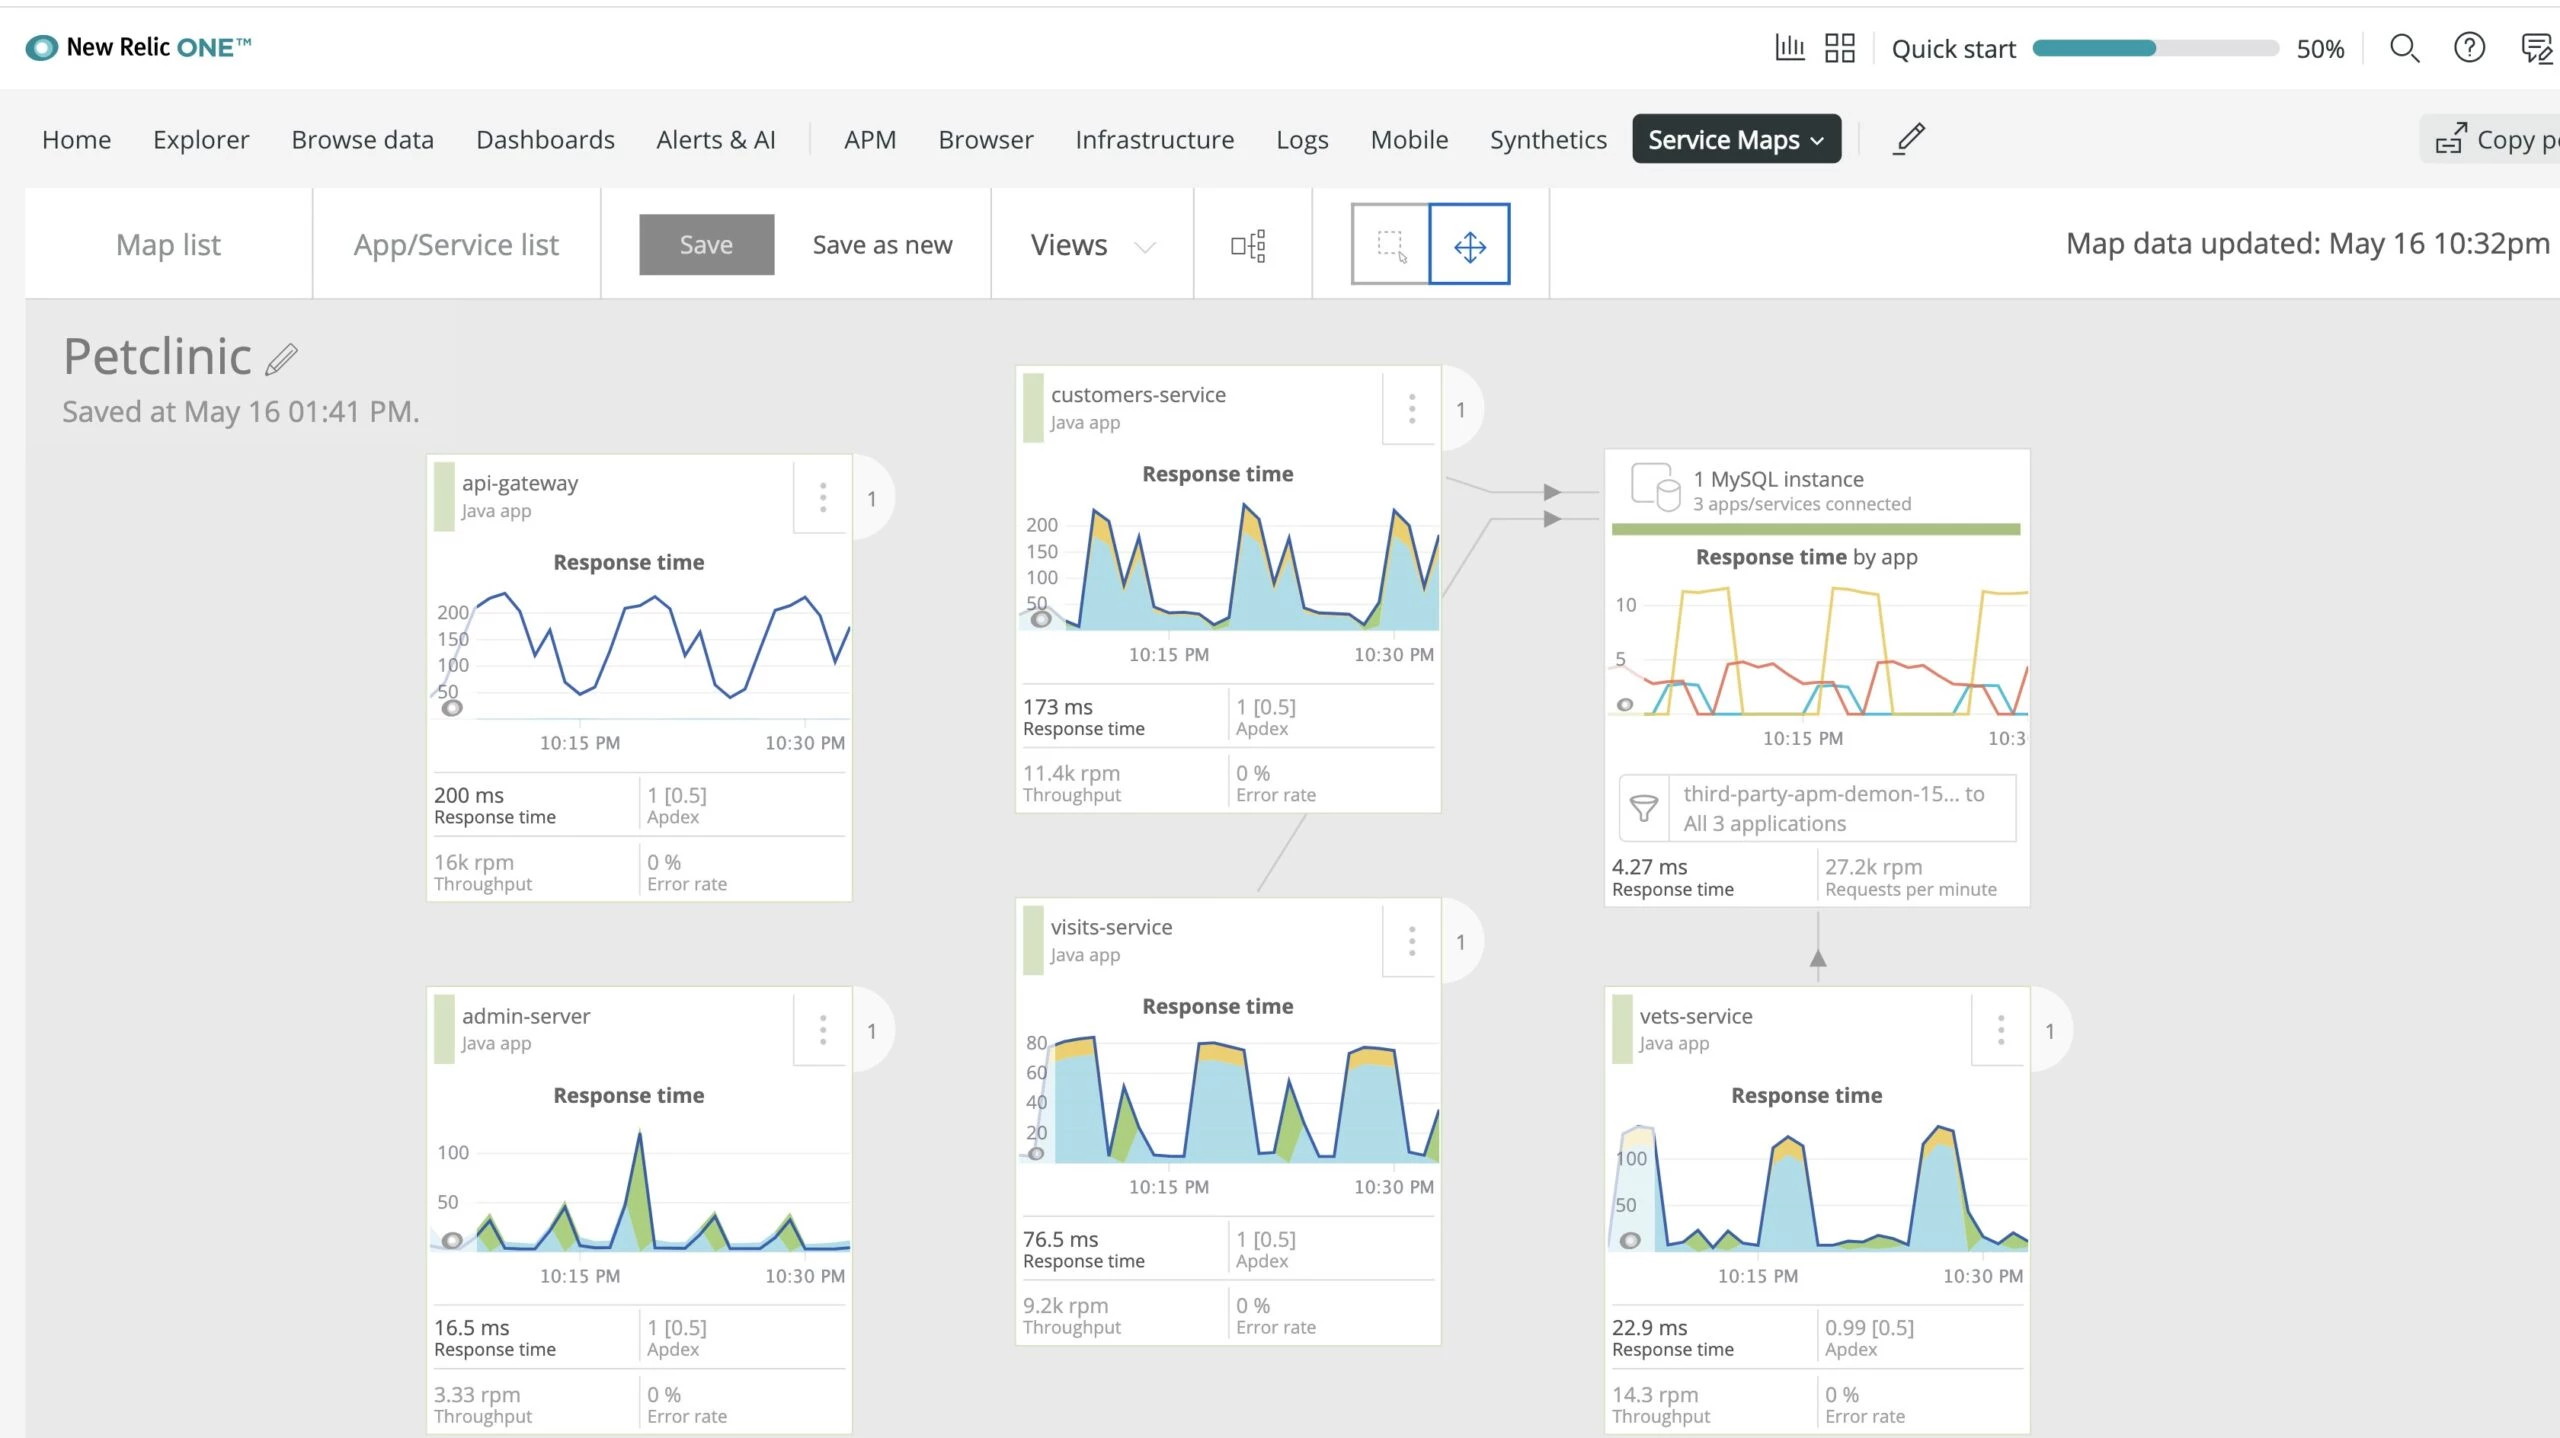
Figure 1: shows all the applications in the popular Petclinic project.
You can observe your application’s performance by navigating through application-by-application in the New Relic One portal. For example, the screenshot below shows transactions processed by customers-service, its throughput, and error rate:
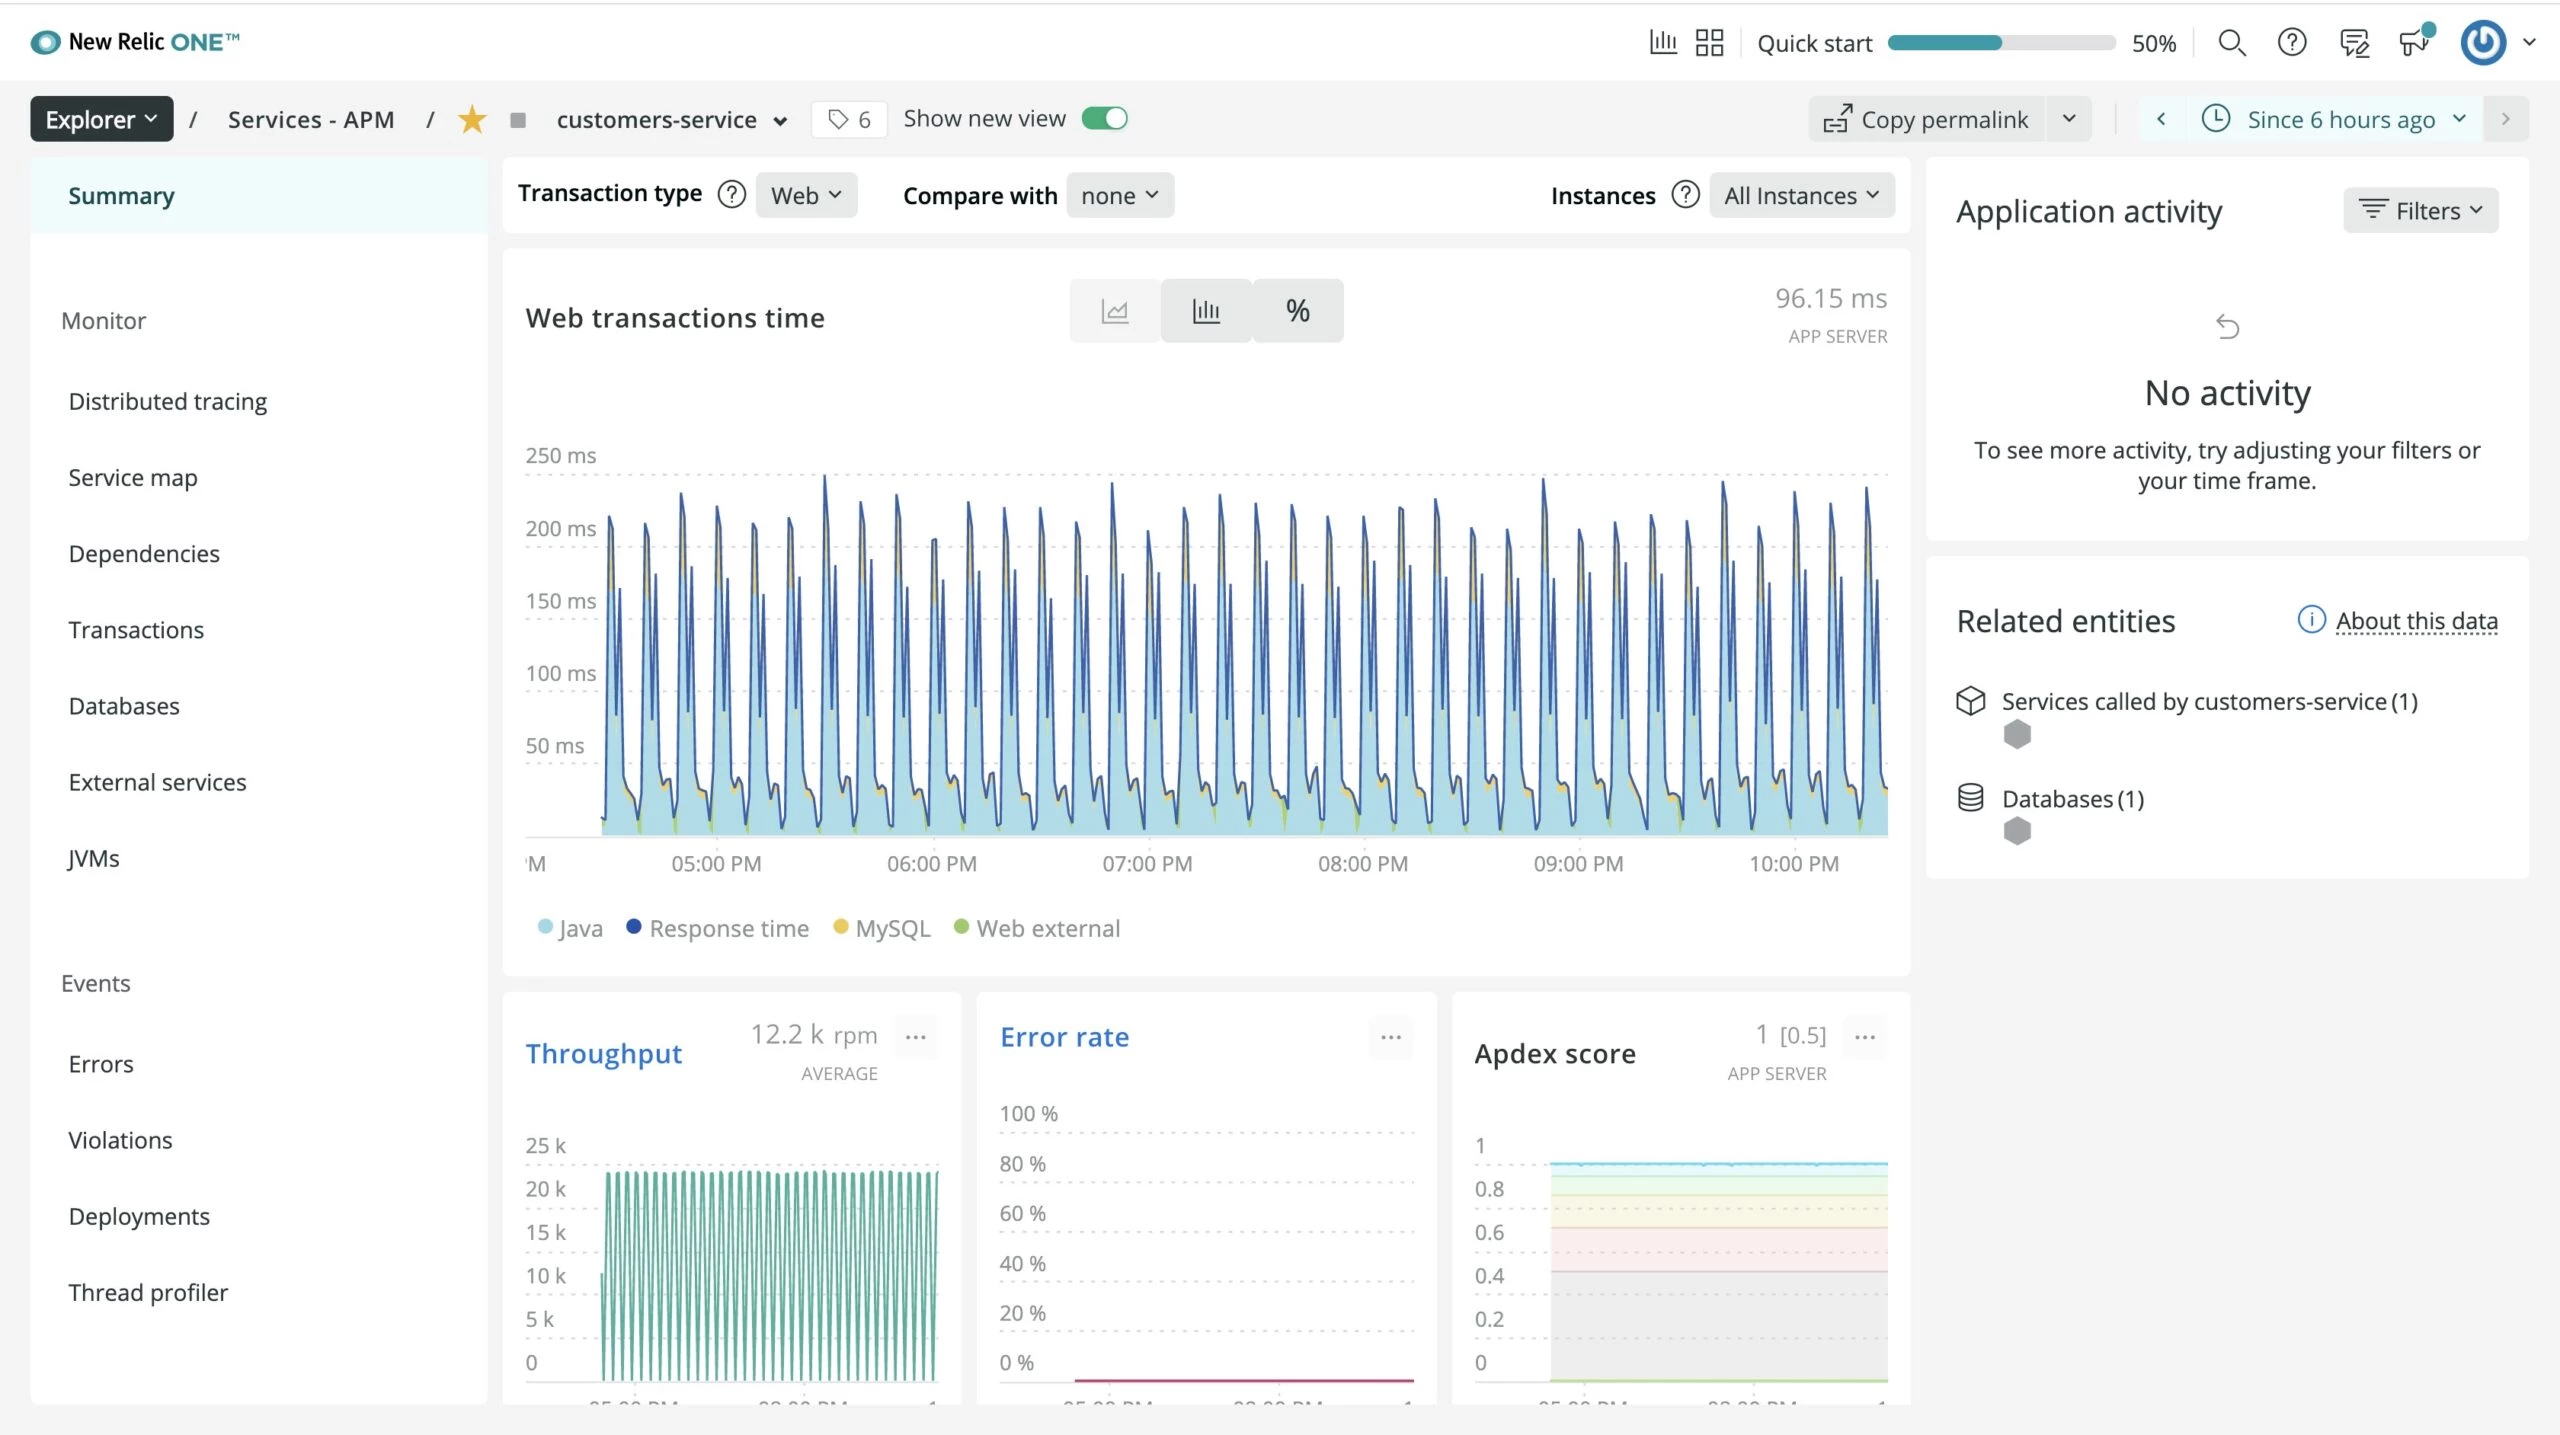
Figure 2: shows transactions processed by customers-service, its throughput, and error rate.
You can look deeper into the underlying Java Virtual Machines by navigating to the “JVMs” blade on the New Relic One portal. For example, the screenshot below shows how many Java Virtual Machines for all the customers-service application instances:
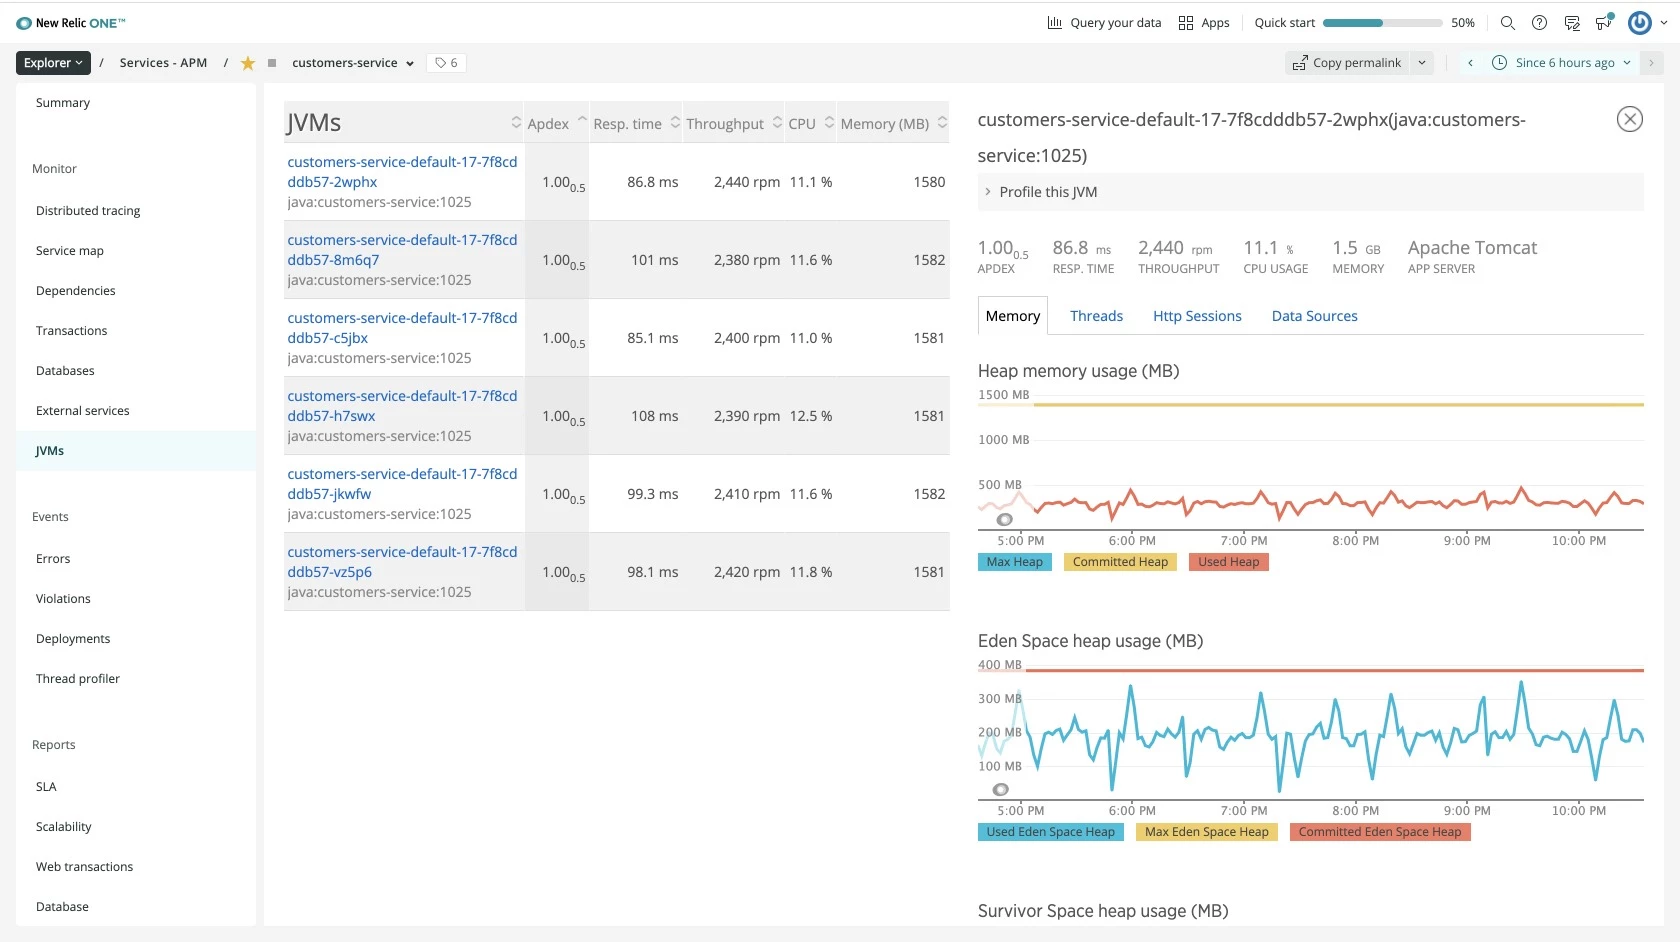
Figure 3: shows how many Java Virtual Machines for all the customers-service application instances.
You can analyze application dependencies, including database transactions by navigating to the “Databases” blade in the New Relic One portal. For example, the screenshot below shows all the database transactions for customers-service:
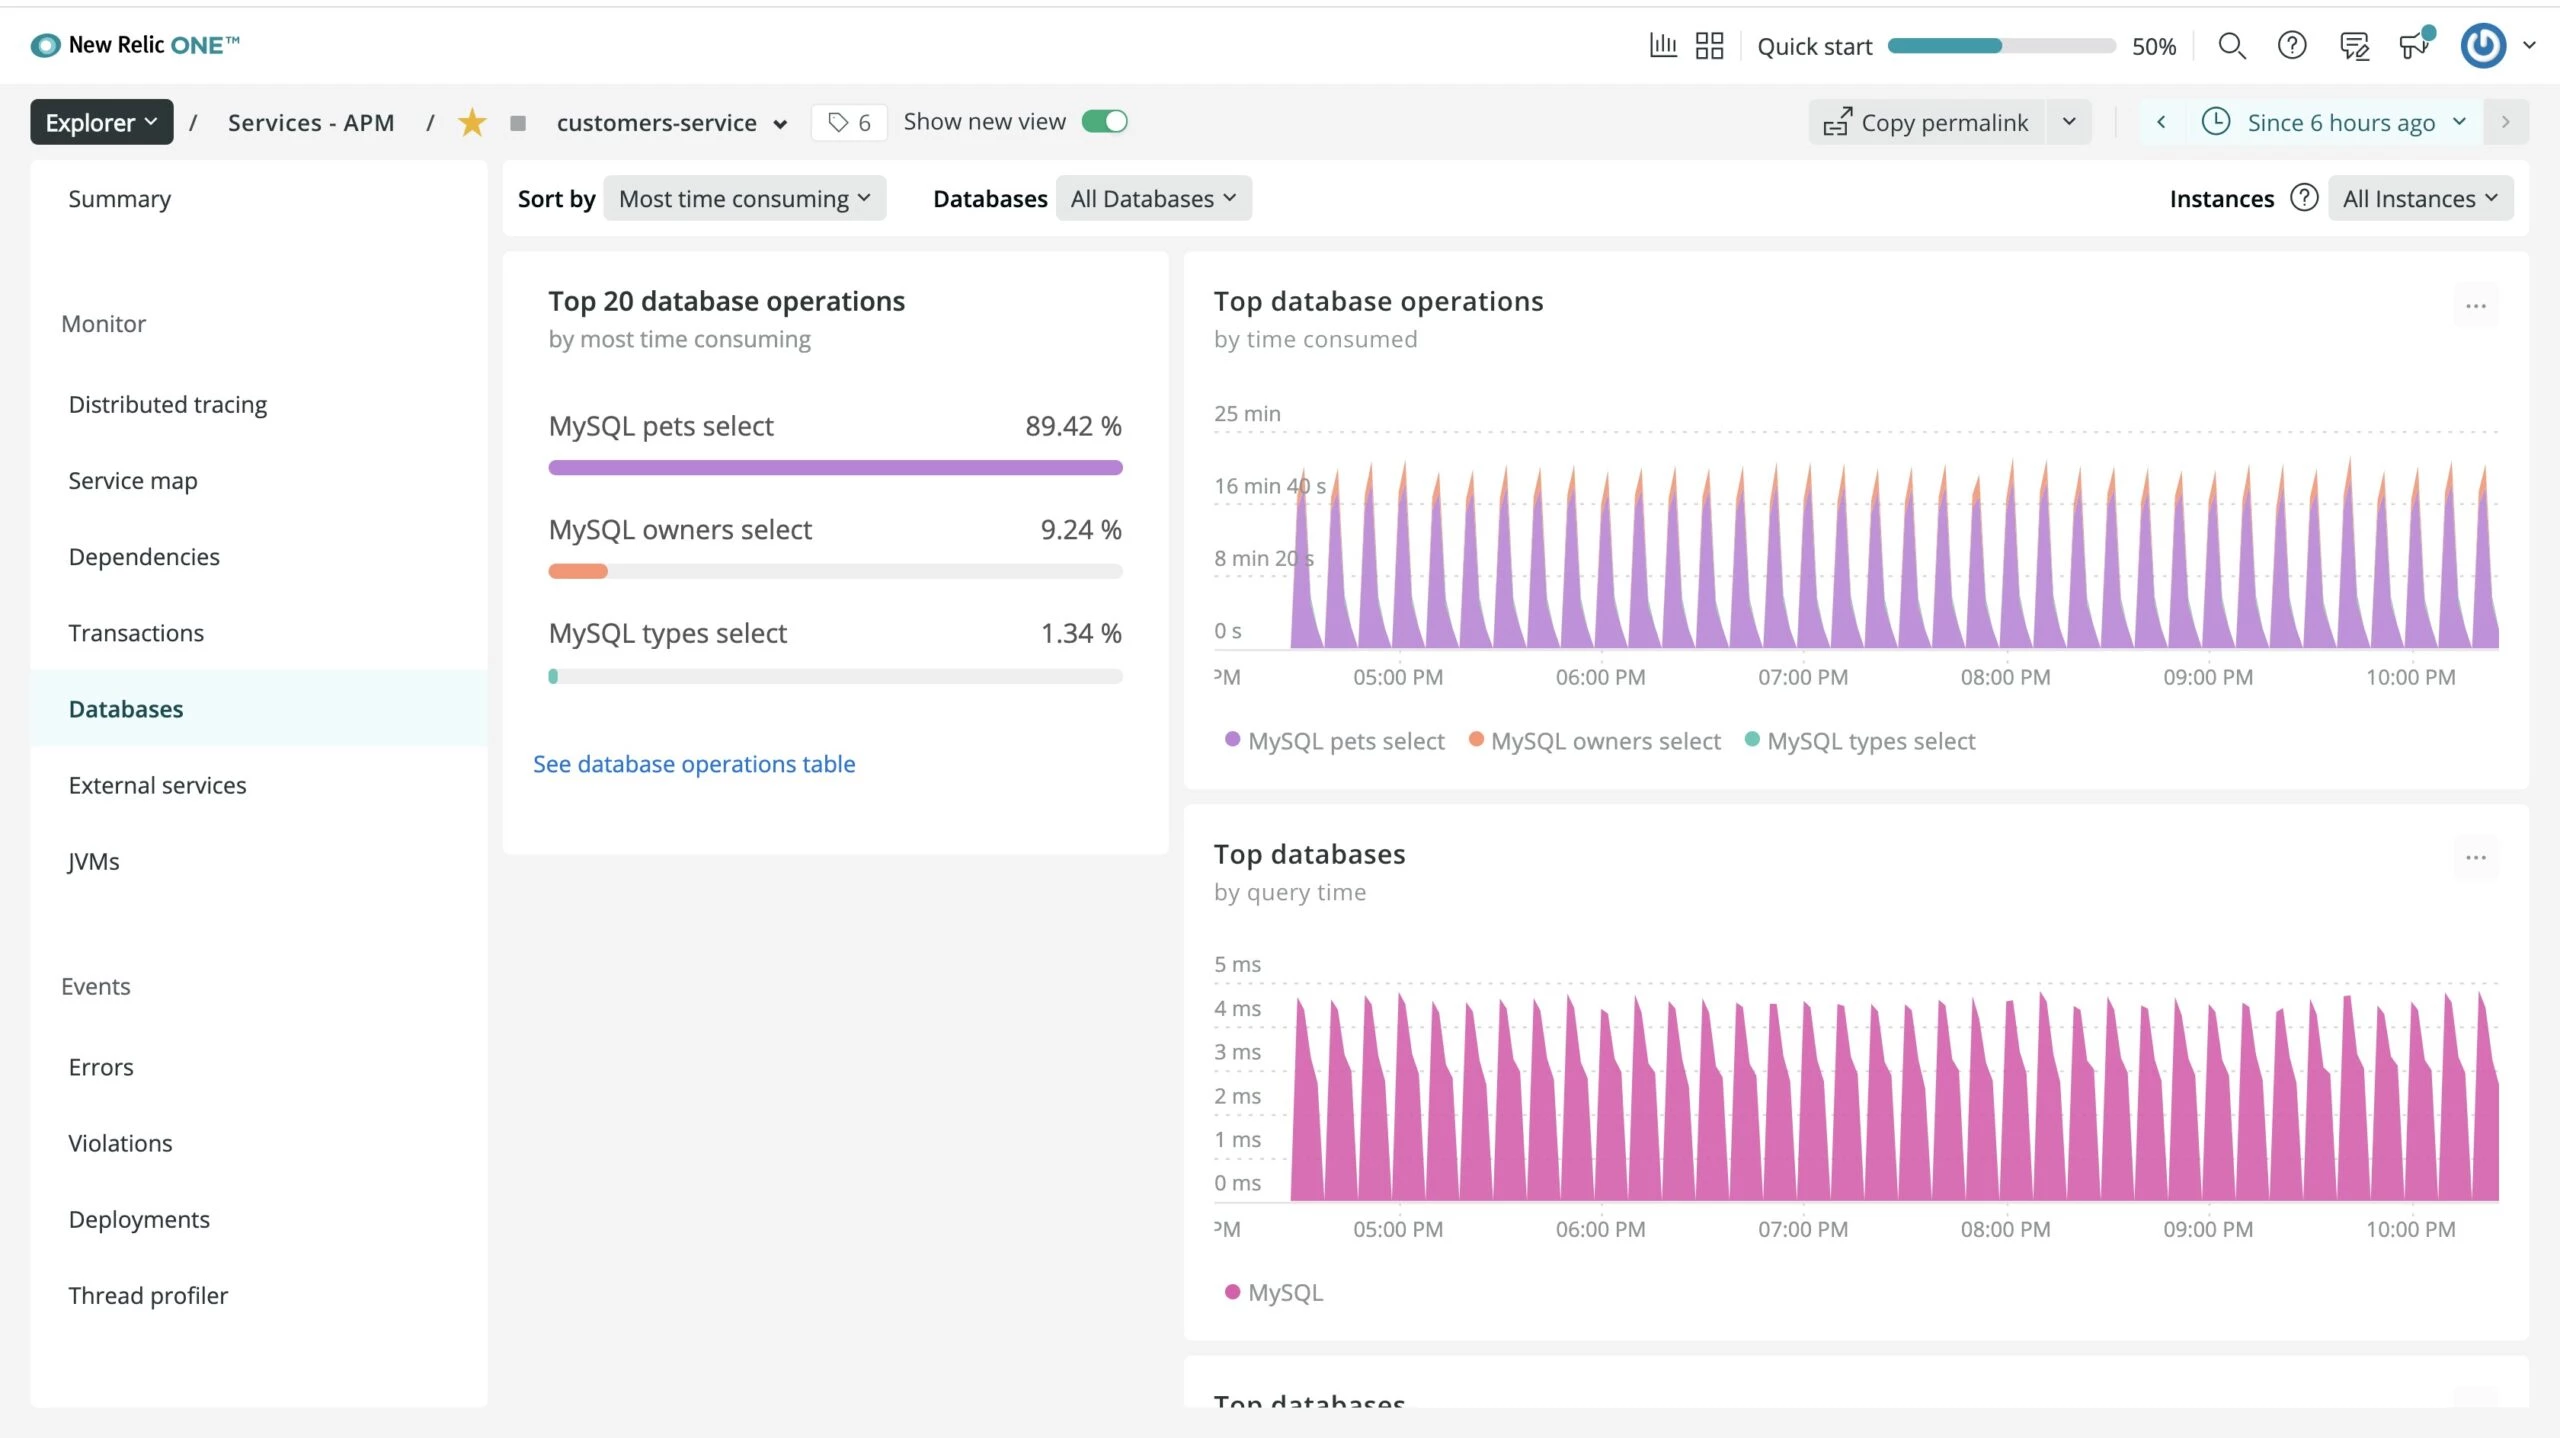
Figure 4: shows all the database transactions for customers-service.
You can look at the stack trace of each thread through the New Relic One Thread Profiler and understand times consumed by Java methods. This provides insights into the “hot” functions of the applications where most time is spent. For example, the screenshot below shows a stack trace of a thread in the customers-service application:
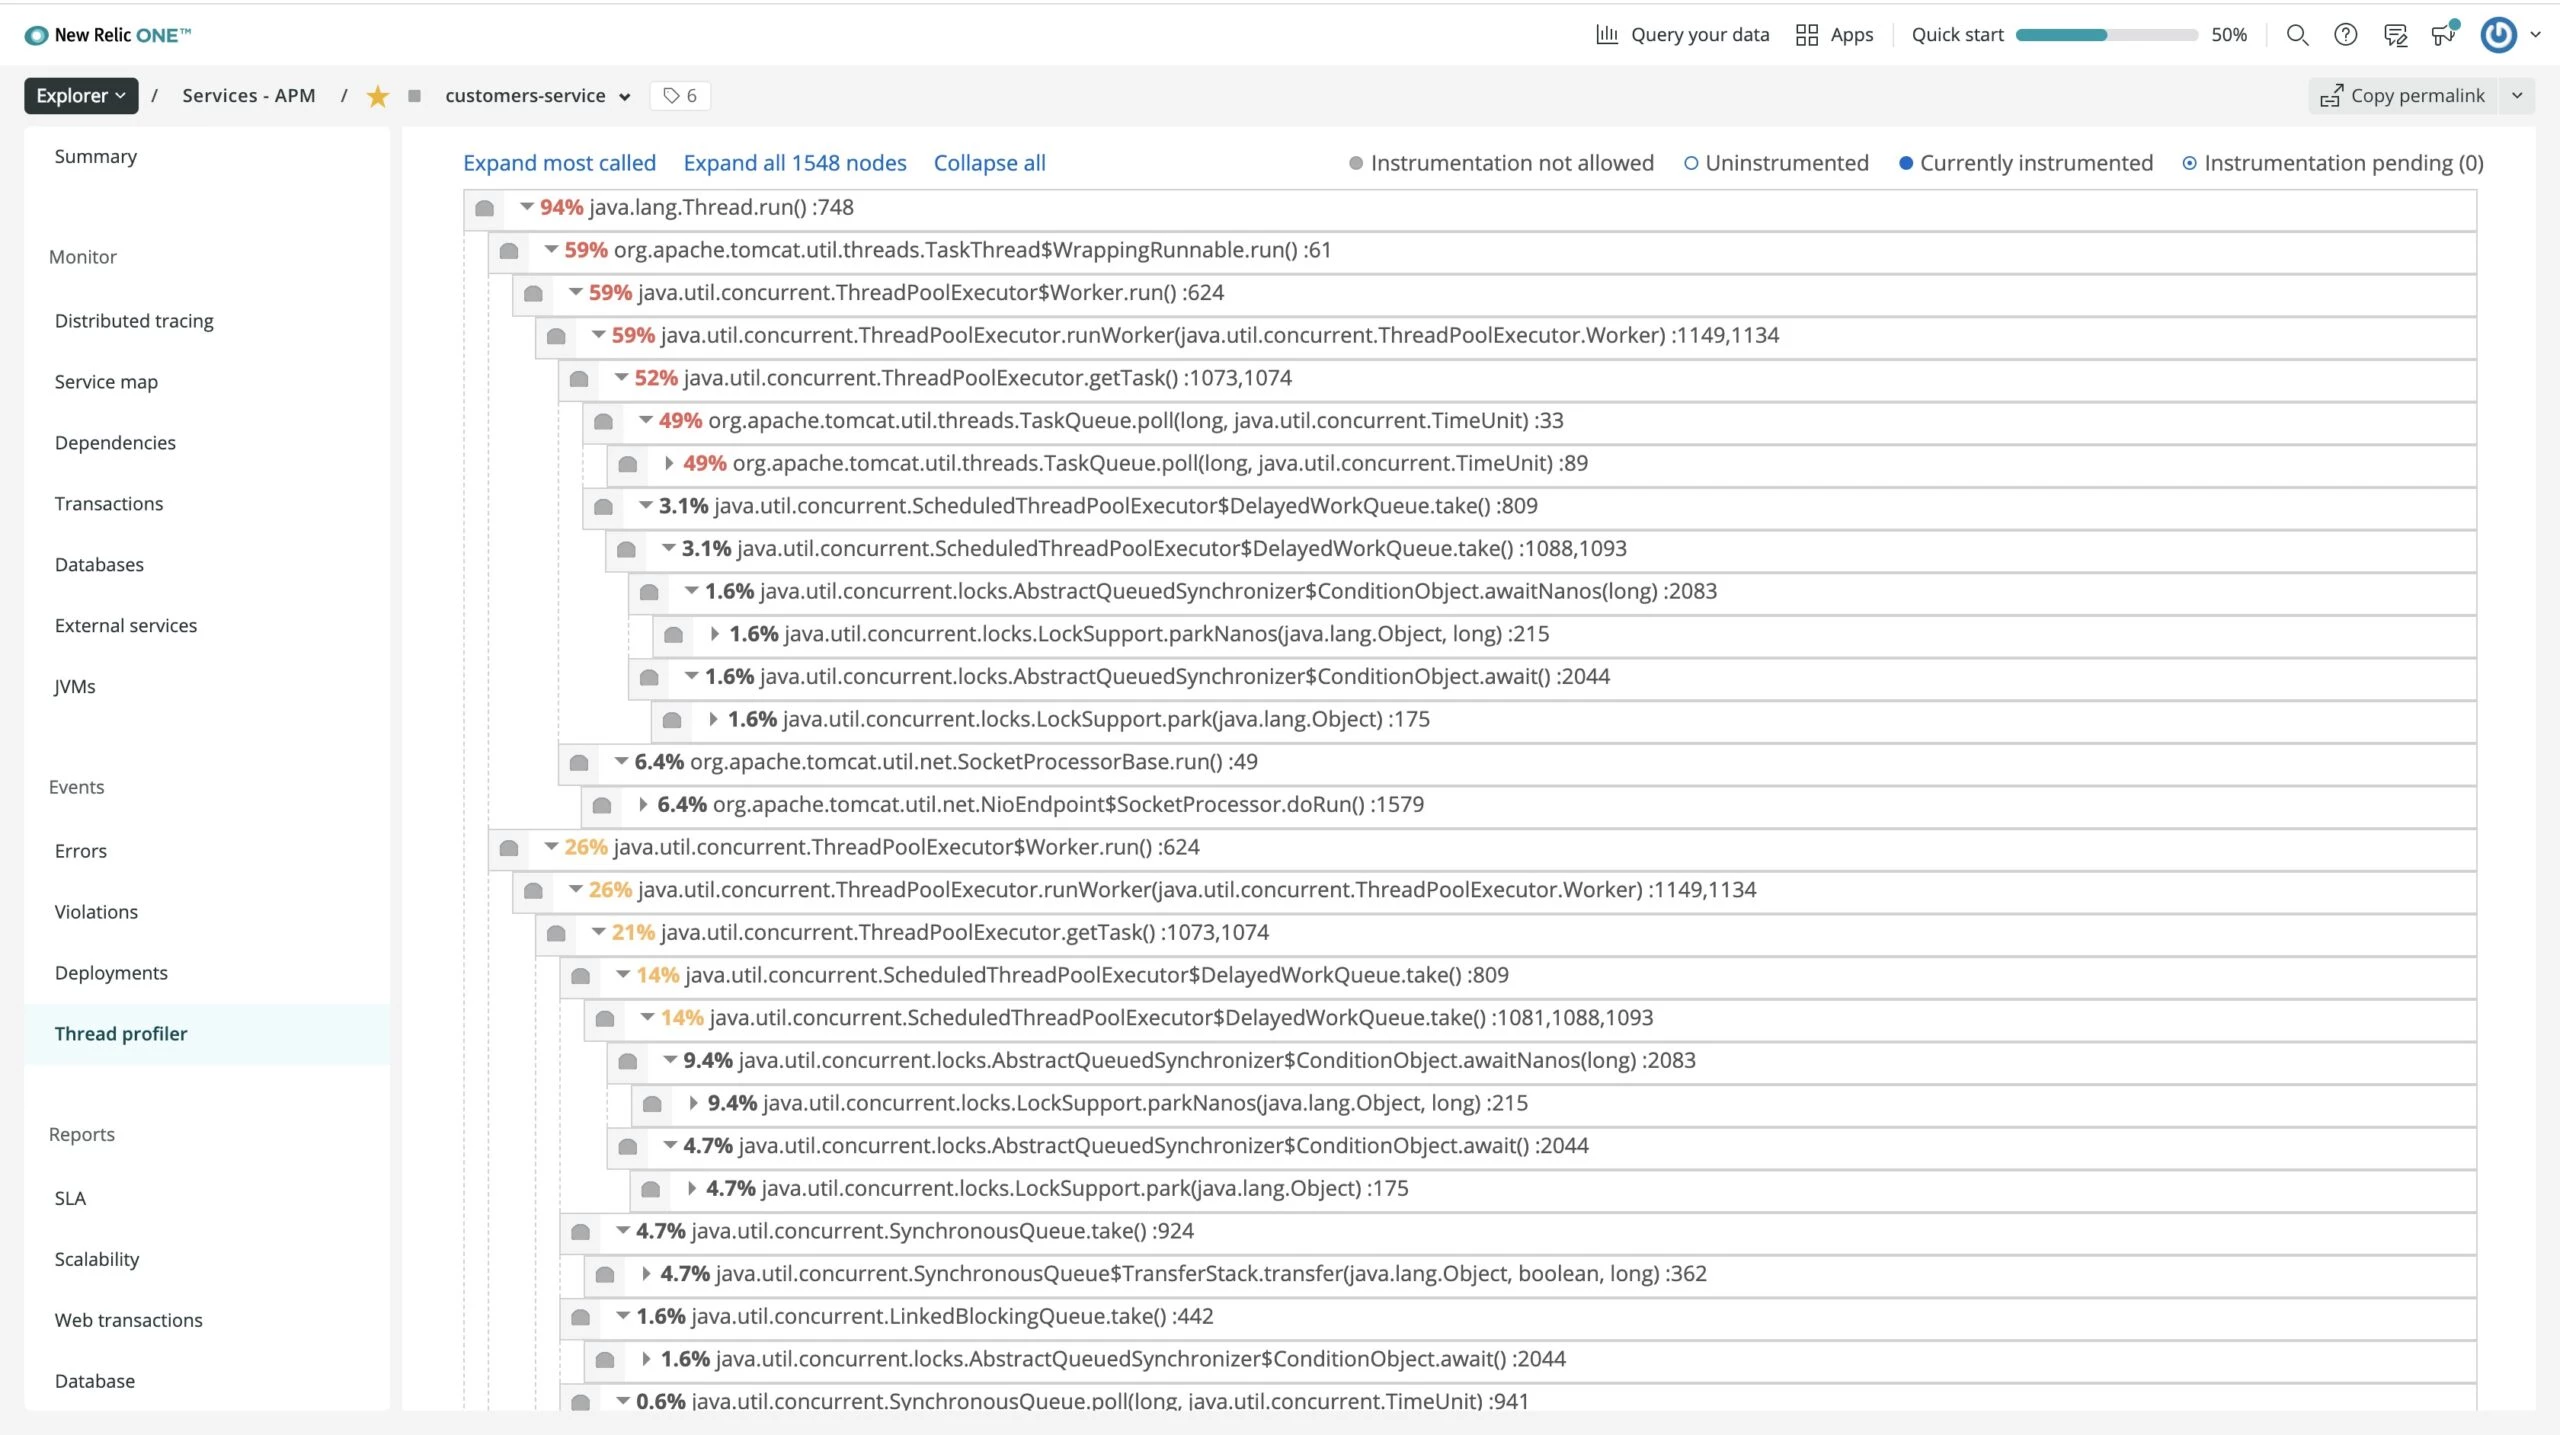
Figure 5: shows a stack trace of a thread in the customers-service.
Deliver value to your end-users
Once instrumented, as you scale out to multiple Spring Boot application instances, any new application instances are automatically monitored for you. You spend less time managing the agent installation and maintenance, and more energy on identifying and resolving incidents faster. Azure Spring Cloud service is on-point for periodically updating the agent.
View of your Spring Boot application instances
New Relic One Navigator offers you an at-a-glance view of the operational health of your application instances. This bird’s eye view of your estate is automatically available to you, no configuration required. Navigator makes it easy for you to explore huge numbers of instances as it intuitively displays your instances in a dense honeycomb view with traffic light colors based on alerts that you define. Quickly identify alerting instances and uncover root causes in addition to seeing which dependent systems might be affected.
As an illustration, the following Navigator view groups your instances across Azure Spring Cloud instances, allowing you to quickly compare your operations in a multi-region deployment. You can group and filter across your instances to quickly zero in on issues. You can also drill down into any instance to see a summary of its activity and any violations along with key metrics and metadata including custom attributes:
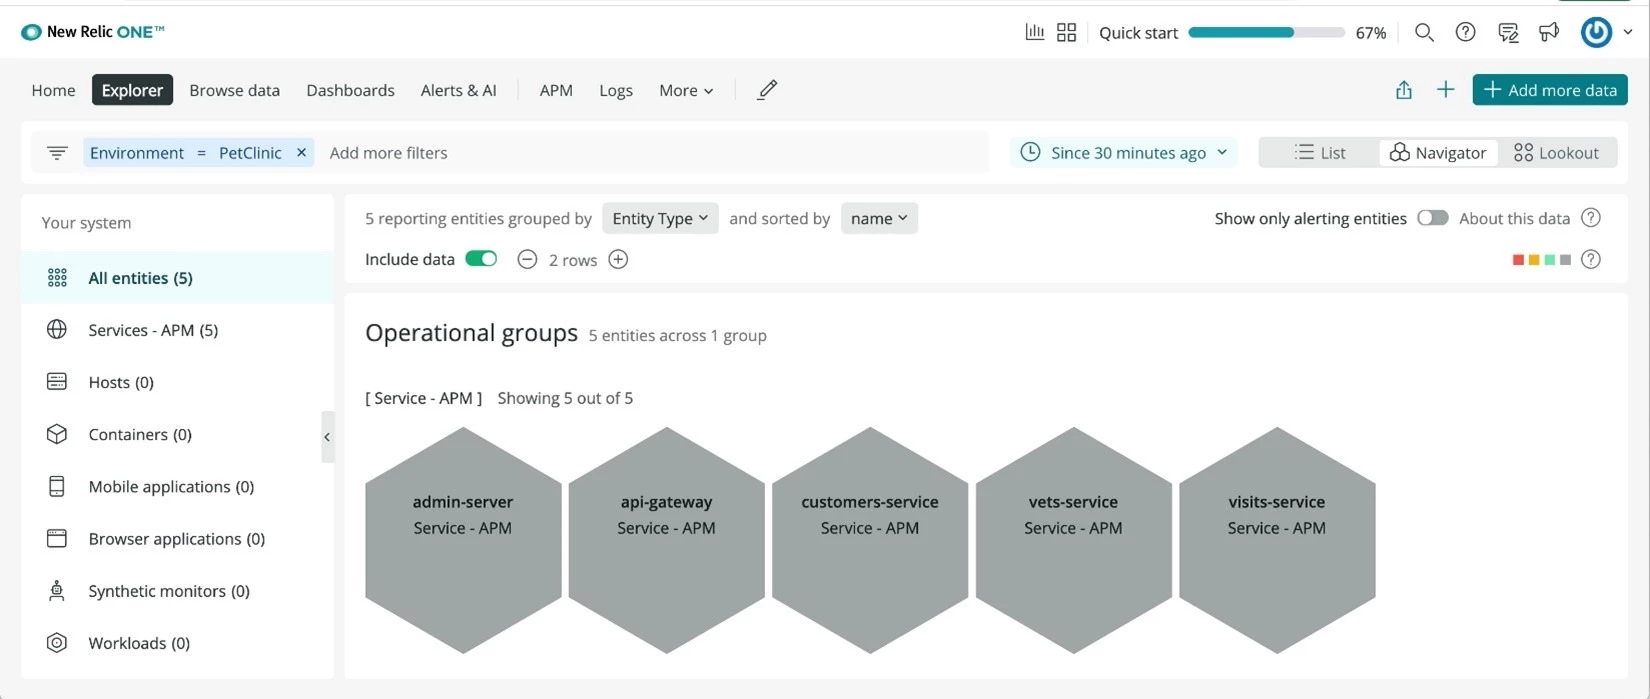
Figure 6: show how Navigator view groups your instances across Azure Spring Cloud instances.
Detect anomalies in your Spring Boot application instances
New Relic Lookout provides an intuitive view of your instances that are deviating from normal behavior, using circle visualization with color indicating the severity of recent signal change and sized proportionally to the magnitude of the metric signal. Lookout automatically compares signals within the last five minutes against the previous hour.
Similarly, you can use New Relic One for monitoring Java applications in Azure services such as Azure Kubernetes Service and Virtual Machines.
Build your solutions and monitor them today
Azure Spring Cloud is jointly built, operated, and supported by Microsoft and VMware. It is a fully managed service for Spring Boot applications that abstracts away the complexity of infrastructure and Spring Cloud middleware management, so you can focus on building your business logic and let Azure take care of dynamic scaling, patches, security, compliance, and high availability. With a few steps, you can provision Azure Spring Cloud, create applications, deploy, and scale Spring Boot applications, and start monitoring in minutes. We will continue to bring more developer-friendly and enterprise-ready features to Azure Spring Cloud.
We would love to hear how you are building impactful solutions using Azure Spring Cloud. Get started today—deploy Spring applications to Azure Spring Cloud using quickstart.
Resources
- Read the companion announcement blog from New Relic.
- Learn using a Microsoft Learn module or self-paced workshop on GitHub.
- Learn more about implementing solutions on Azure Spring Cloud.
- Learn more about New Relic Java agent in Azure Spring Cloud.
- Deploy a distributed version of Spring Petclinic built with Spring Cloud.
- Deploy Spring Boot applications by leveraging enterprise best practices—Azure Spring Cloud reference architecture.
- Migrate your Spring Boot, Spring Cloud, and Tomcat applications to Azure Spring Cloud.
- Wire Spring applications to interact with Azure services.
- For feedback and questions, please email us.