Azure Site Recovery has enhanced the health monitoring of your workloads by introducing various health signals on the replication component, Process Server. The Process Server (PS) in a hybrid DR scenario is a vital component of data replication. It handles replication caching, data compression, and data transfer. Once the workloads are protected issues can be triggered due to multiple factors including high data change rate (churn) at source, network connectivity, available bandwidth, under provisioning the Process Server, or protecting large number of workloads with a single Process Server. These may lead to bad state of the PS and have a cascading effect on replication of VMs.
Troubleshooting these issues is now made easier with additional health signals from the Process Server. It is quick to identify which Process Server is being used by a virtual machine, and easy to relate the health between the two. Notifications are raised on multiple parameters of PS – free space utilization, memory usage, CPU utilization, and achieved throughput. Both warning and critical alerts are released so that action can be taken at the right time. This helps users avoid running into large scale issue which may impact multiple machines connected to a PS.
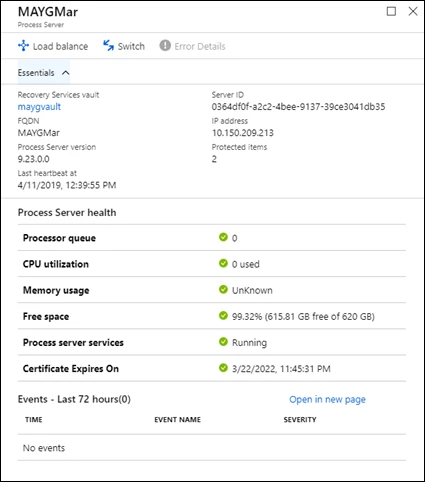
View of the PS blade
Warning and critical events are raised as per the below thresholds set by Azure Site Recovery. Supplemental alerts include issues related to PS services and PS heartbeat. On the portal all these health events are collated on PS blade for deep dive monitoring with up to 72 hours of data points in the events table. Note that throughput is measured in terms of achievable RPO.
| Parameter | Warning Threshold | Critical Threshold |
| CPU utilization | 80% | 95% |
| Memory usage | 80% | 95% |
| Free Space | 30% | 25% |
| Achievable RPO | >30 mins | >45 mins |
A clear relation between the PS and its replicated items is established on the replicated item blade. This helps in faster issue identification and resolution for ongoing replication.
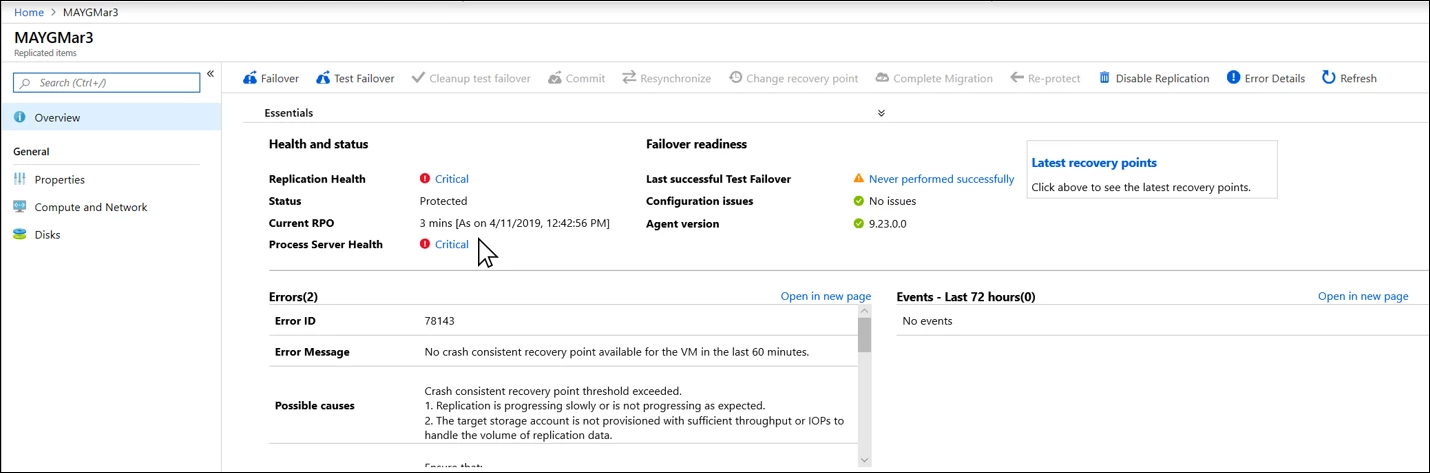
A view of the replicated item blade.
All these health signals roll up to consolidated Process Server health. This visible parameter helps in choosing a PS when new machines need to be protected, or when load balancing between existing PSes is required. At the time of Process Server selection the warning health status deters the user’s choice by raising warning, while critical health completely blocks the PS selection. The signals are powerful as the scale of the workloads grows. This guidance ensures that the apt number of virtual machines are connected to a Process Server, and that related issues can be avoided.
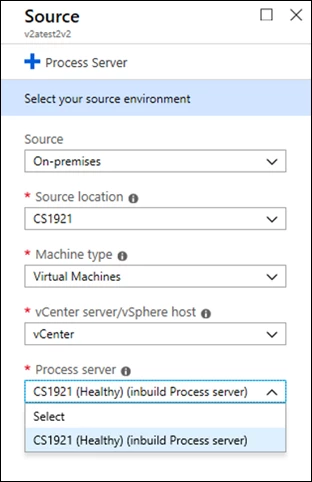
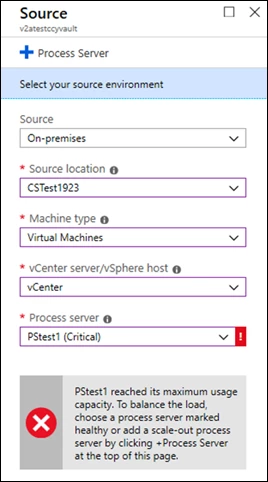
Enable Replication Workflow with Healthy Process Server (Left) and with Critical Process Server (Right)
Process Server health signals for CPU utilization, memory usage and free space are available from 9.24 version onwards. Throughput related alerts will be available in the subsequent releases.
Related links and additional content
- Set up disaster recovery for VMware or physical machines to Azure
- Manage Process Servers
- Learn more about Azure Site Recovery churn limits
- Troubleshoot the Process Server