It is imperative to monitor the health of your virtual machine. But how much time do you spend reviewing each metric and alert to monitor the health of a virtual machine?
We are announcing the preview of Azure Monitor for virtual machines guest health feature that monitors the health of your virtual machines and fires an alert when any parameter being monitored is outside the acceptable range. This feature provides you:
- A simple experience to monitor the overall health of your virtual machine.
- Out-of-the-box health monitors based on key VM metrics to track the health of your virtual machine.
- Out-of-the-box alerts to notify if the virtual machine is unhealthy.
Virtual machine guest health feature has a parent-child hierarchical model. It monitors the health state of CPU, disks, and memory for a virtual machine and notifies the customer about the changes. The three states—healthy, warning, and critical—are defined based on the thresholds set by the customer for each child monitor. Each monitor measures the health of a particular component. The overall health of the virtual machine is determined by the health of its individual monitors. The top level monitor on the VM groups the health state of all the child monitors and provides a single health state of the virtual machine. It matches the state of the child monitor with the least healthy state.
Get started
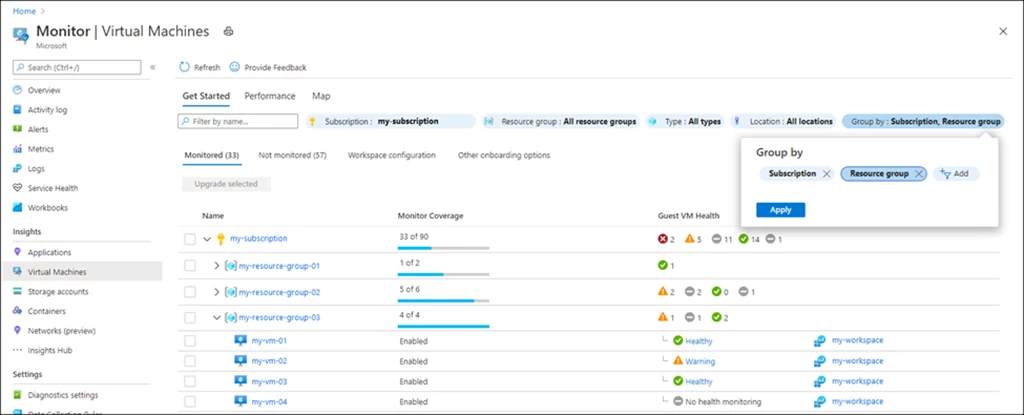
You can view the health of each VM in your subscription and resource group in the Guest VM health column from the get started page of Azure Monitor for virtual machines.
Health tree
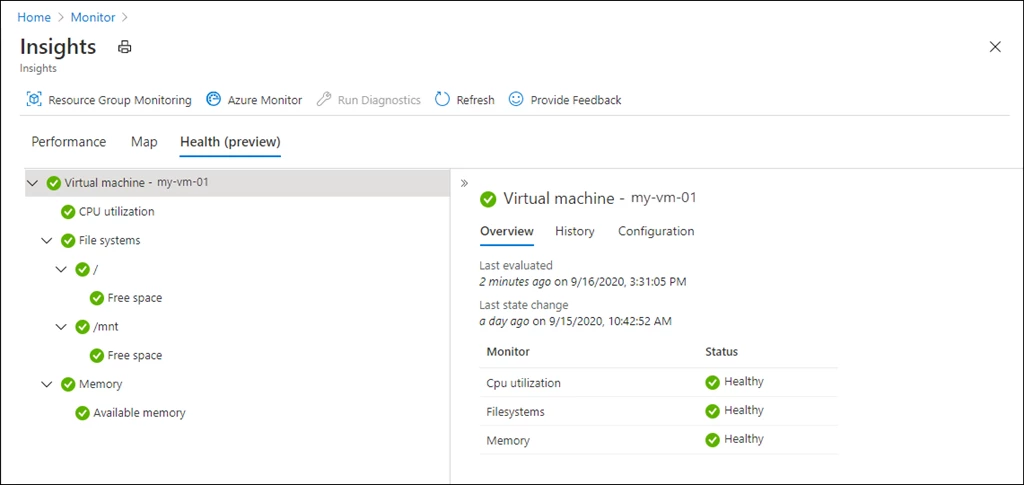
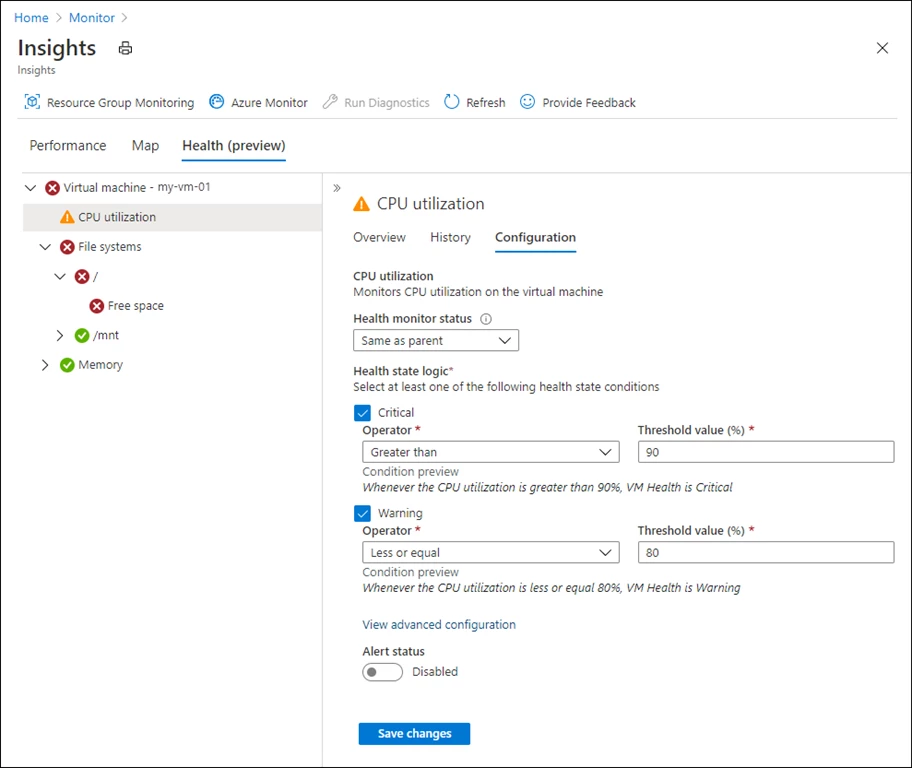
You can view the detailed health status of the VM by clicking on the health status from the get started page. In the side pane, the overview tab provides a description of the monitor, the last time it was evaluated, and values sampled to determine the current health state. The history tab lists the history of state changes for the monitor. You can view and modify the thresholds for critical and warning states for each monitor from the configuration tab. From this tab, you can also enable the alert status if you wish to receive an alert upon the state change of the monitor.
Pricing
There is no direct cost for the guest health feature, but there is a cost for ingestion and storage of health state data in the Log Analytics workspace. All data is stored in the HealthStateChangeEvent table.
Supported OS and regions
For the preview, only Azure Virtual Machines are supported. Virtual machine scale sets and Azure Arc for servers are not currently supported.
- Virtual machine must run one of the following operating systems:
- Ubuntu 16.04 LTS, Ubuntu 18.04 LTS
- Windows Server 2012 or later
- Virtual machine and Log Analytics workspace must be located in one of the regions as listed here.
Check out our full documentation to get more details. We’d love to hear what you like and don’t like about this feature, and where you’d like us to take it. Please click Provide Feedback in the user experience to share your thoughts.