On December 4, 2018 Microsoft’s Azure Database for open sources announced the general availability of MariaDB. This blog intends to share some guidance and best practices for alerting on the most commonly monitored metrics for MariaDB.
Whether you are a developer, a database analyst, a site reliability engineer, or a DevOps professional at your company, monitoring databases is an important part of maintaining the reliability, availability, and performance of your MariaDB server. There are various metrics available for you in Azure Database for MariaDB to get insights on the behavior of the server. You can also set alerts on these metrics using the Azure portal or Azure CLI.
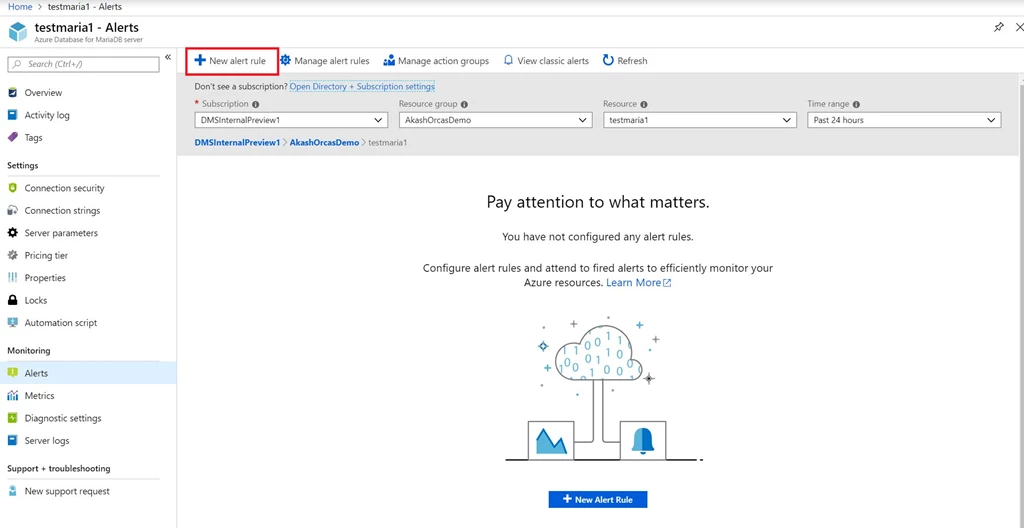
With modern applications evolving from a traditional on-premises approach to becoming more hybrid or cloud native, there is also a need to adopt some best practices for a successful monitoring strategy on a hybrid/public cloud. Here are some example best practices on how you can use monitoring data on your MariaDB server and areas you can consider improving based on these various metrics.
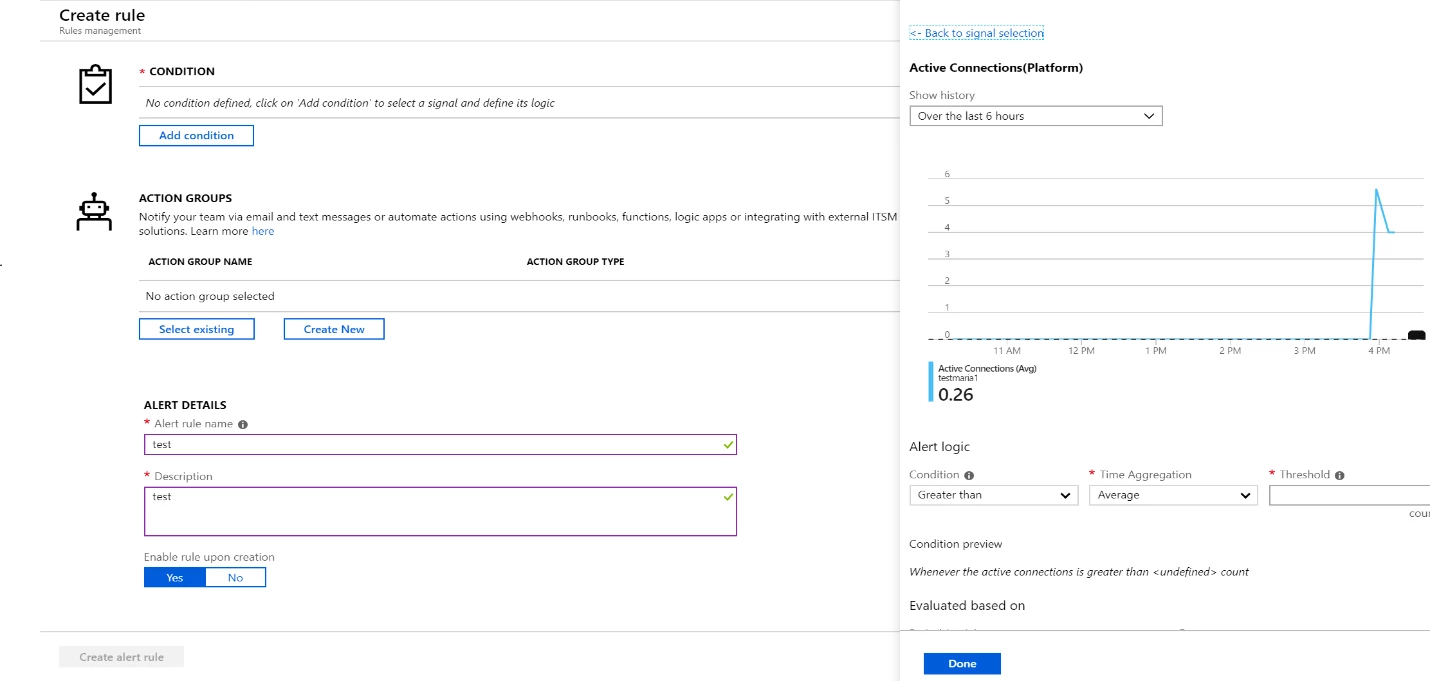
Active connections
Sample threshold (percentage or value): 80 percent of total connection limit for greater than or equal to 30 minutes, checked every five minutes.
Things to check
- If you notice that active connections are at 80 percent of the total limit for the past half hour, verify if this is expected based on the workload.
- If you think the load is expected, active connections limits can be increased by upgrading the pricing tier or vCores. You can check active connection limits for each SKU in our documentation, “Limitations in Azure Database for MariDB.”
Failed connections
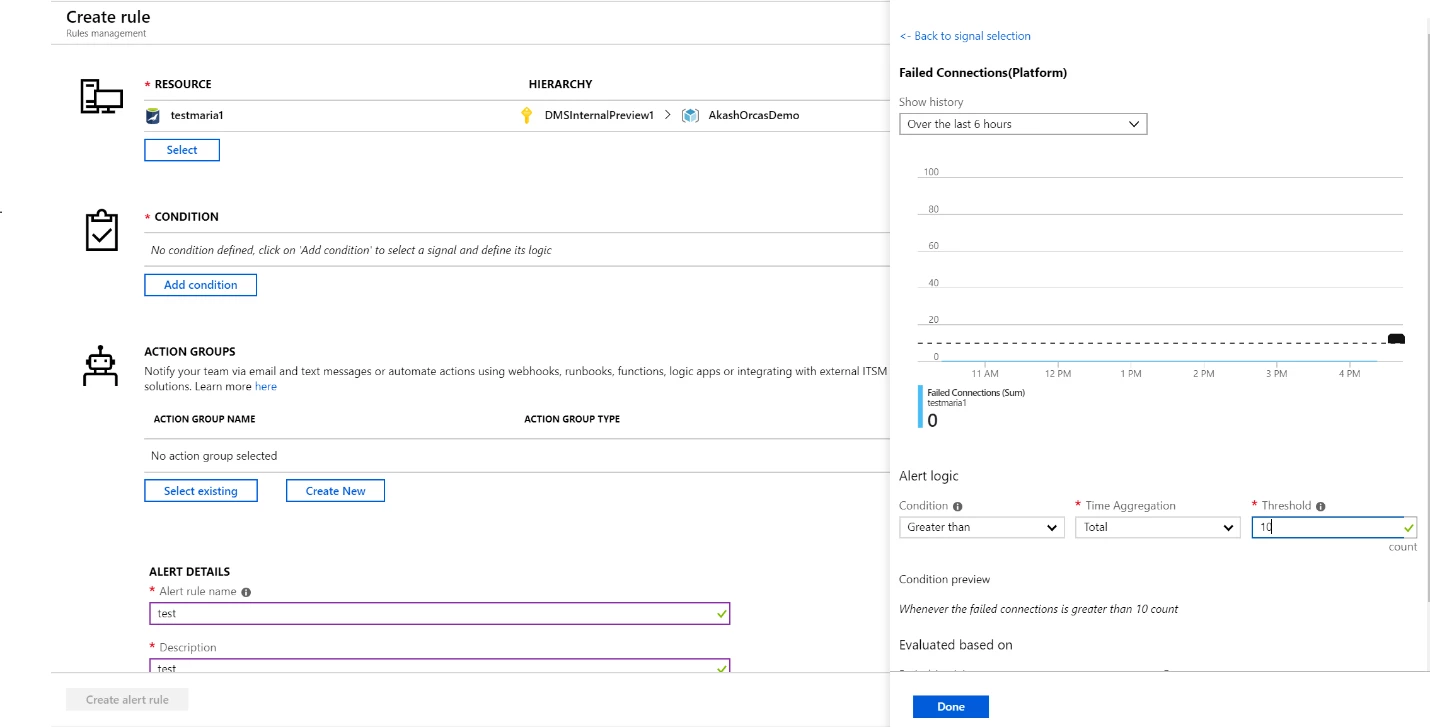
Sample threshold (percentage or value): 10 failed connections in the last 30 minutes, checked every five minutes.
Things to check
- If you see connection request failures over the last half hour, verify if this is expected by checking the logs for failure reasons.
- If this is a user error, take the appropriate action. For example, if authentication yields a failed error check your username/password.
- If the error is SSL related, check the SSL settings and input parameters are properly configured.
- Example: psql “sslmode=verify-ca sslrootcert=root.crt host=mydemoserver.mariadb.database.azure.com dbname=mariadb user=mylogin@mydemoserver”
CPU percent or memory percent
Sample threshold (percent or value): 100 percent for five minutes or 95 percent for more than two hours.
Things to check
- If you have hit 100 percent CPU or memory usage, check your application telemetry or logs to understand the impact of the errors.
- Review the number of active connections. Check for connection limits in our documentation, “Limitations in Azure Database for MariaDB.” If your application has exceeded the max connections or is reaching the limits, then consider scaling up compute.
IO percent
Sample threshold (percent or value): 90 percent usage for greater than or equal to 60 minutes.
Things to check
- If you see that IOPS is at 90 percent for one hour or more, verify if this is expected based on the application workload.
- If you expect a high load, then increase the IOPS limit by increasing storage. Storage to IOPS mapping is illistrated below as a reference.
Storage
The storage you provision is the amount of storage capacity available to your Azure Database for PostgreSQL server. The storage is used for the database files, temporary files, transaction logs, and the PostgreSQL server logs. The total amount of storage you provision also defines the I/O capacity available to your server.
| Basic | General purpose | Memory optimized | |
| Storage type | Azure Standard Storage | Azure Premium Storage | Azure Premium Storage |
| Storage size | 5GB TO 1TB | 5GB to 4TB | 5GB to 4TB |
| Storage increment size | 1GB | 1GB | 1GB |
| IOPS | Variable | 3IOPS/GB Min 100 IOPS Max 6000 IOPS | 3IOPS/GB Min 100 IOPS Max 6000 IOPS |
Storage percent
Sample threshold (percent or value): 80 percent
Things to check
- If your server is reaching provisioned storage limits, it will soon be out of space and set to read-only.
- Please monitor your usage. You can also provision for more storage to continue using the server without deleting any files, logs, and more.
If you have tried everything and none of the monitoring tips mentioned above lead you to a resolution, please don’t hesitate to contact Microsoft Azure Support.
Acknowledgments
Special thanks to Andrea Lam, Program Manager, Azure Database for MariaDB for her contributions to this blog.