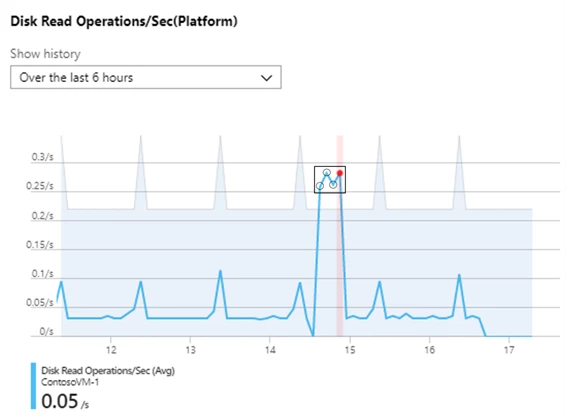
We are happy to announce that Metric Alerts with Dynamic Thresholds is now available in public preview. Dynamic Thresholds are a significant enhancement to Azure Monitor Metric Alerts. With Dynamic Thresholds you no longer need to manually identify and set thresholds for alerts. The alert rule leverages advanced machine learning (ML) capabilities to learn metrics’ historical behavior, while identifying patterns and anomalies that indicate possible service issues.
Metric Alerts with Dynamic Thresholds are supported through a simple Azure portal experience, as well as provides support for Azure workloads operations at scale by allowing users to configure alert rules through an Azure Resource Manager (ARM) API in a fully automated manner.
Why and when should I apply Dynamic Thresholds to my metrics alerts?
Smart metric pattern recognition – A big pain point with setting static threshold is that you need to identify patterns on your own and create an alert rule for each pattern. With Dynamic Thresholds, we use a unique ML technology to identify the patterns and come up with a single alert rule that has the right thresholds and accounts for seasonality patterns such as hourly, daily, or weekly. Let’s take the example of HTTP requests rate. As you can see below, there is definite seasonality here. Instead of setting two or more different alert rules for weekdays and weekends, you can now get Azure Monitor to analyze your data and come up with a single alert rule with Dynamic Thresholds that changes between weekdays and weekends.
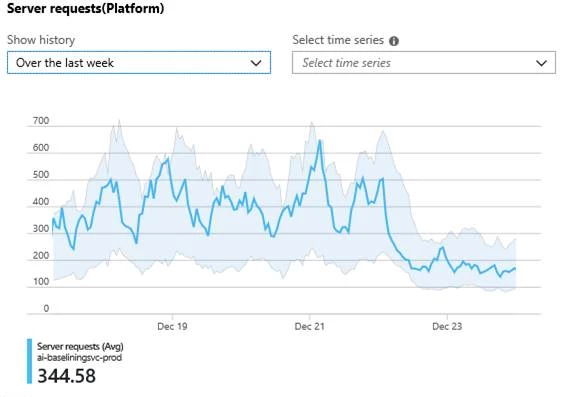
Scalable alerting – Wouldn’t it be great if you could automatically apply an alert rule on CPU usage to any virtual machine (VM) or application that you create? With Dynamic Thresholds, you can create a single alert rule that can then be applicable automatically to any resource that you create. You don’t need to provide thresholds. The alert rule will identify the baseline for the resource and define the thresholds automatically for you. With Dynamic Thresholds, you now have a scalable approach that will save a significant amount of time on management and creation of alerts rules.
Domain knowledge – Setting a threshold often requires a lot of domain knowledge. Dynamic Thresholds eliminates that need with the use of your ML algorithms. Further, we have optimized the algorithms for common use cases such as CPU usage for a VM or requests duration for an application. So you can have full confidence that the alert will capture any anomalies while still reducing the noise for you.
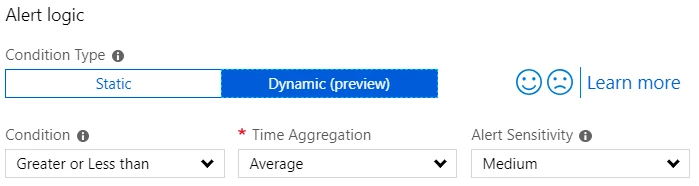
Intuitive configuration – Dynamic Thresholds allow setting up metric alerts rules using high-level concepts, alleviating the need to have extensive domain knowledge about the metric. This is expressed by only requiring users to select the sensitivity for deviations (low, medium, high) and boundaries (lower, higher, or both thresholds) based on the business impact of the alert in the UI or ARM API.
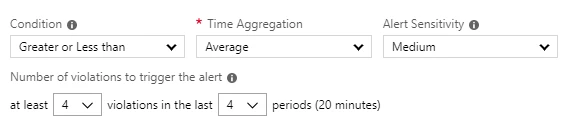
Dynamic Thresholds also allow you to configure a minimum amount of deviations required within a certain time window for the system to raise an alert, the default time window is four deviations in 20 minutes. The user can configure this and choose what he/she would like to be alerted on by changing the failing periods and time window.
Metric Alerts with Dynamic Threshold is currently available for free during the public preview. To see the pricing that will be effective at general availability, visit our pricing page. To get started, please refer to the documentation, “Metric Alerts with Dynamic Thresholds in Azure Monitor (Public Preview).” We would love to hear your feedback! If you have any questions or suggestions, please reach out to us at azurealertsfeedback@microsoft.com.
Please note, Dynamic Threshold based alerts are available for all Azure Monitor based metric sources listed in the documentation, “Supported resources for metric alerts in Azure Monitor.”