Announcements, Azure Monitor, Compute, Management and Governance, Virtual Machines
New Project Flash Update: Advancing Azure Virtual Machine availability monitoring
Posted on
9 min read
“Earlier this year, we introduced Project Flash in the Advancing Reliability blog series, to reaffirm our commitment to empowering Azure customers in monitoring virtual machine (VM) availability in a robust and comprehensive manner. Today, we’re excited to share the progress we’ve made since then in developing holistic monitoring offerings to meet customers’ distinct needs. I’ve asked Senior Technical Program Manager, Pujitha Desiraju, from the Azure Core Production Quality Engineering team to share the latest investments as part of Project Flash, to deliver the best monitoring experience for customers.”—Mark Russinovich, CTO, Azure.
Flash, as the project is internally known, is a collection of efforts across Azure Engineering, that aims to evolve Azure’s virtual machine (VM) availability monitoring ecosystem into a centralized, holistic, and intelligible solution customers can rely on to meet their specific observability needs. As part of this multi-year endeavor, we’re excited to announce the:
- General availability of VM availability information in Azure Resource Graph for efficient and at-scale monitoring, convenient for detailed downtime investigations and impact assessment.
- Preview of a VM availability metric in Azure Monitor for quick debugging is now publicly available, trend analysis of VM availability over time, and setting up threshold-based alerts on scenarios that impact workload performance.
- Preview of VM availability status change events via Azure Event Grid for instantaneous notifications on critical changes in VM availability, to quickly trigger remediation actions to prevent end-user impact.
Our commitment remains, to maintaining data consistency and similar rigorous quality standards across all the monitoring solutions that are part of Flash, including existing solutions like Resource Health or Activity Log, so we deliver a consistent and cohesive experience to customers.
VM availability information in Azure Resource Graph for at-scale analysis
In addition to already flowing VM availability states, we recently published VM health annotations to Azure Resource Graph (ARG) for detailed failure attribution and downtime analysis, along with enabling a 14-day change tracking mechanism to trace historical changes in VM availability for quick debugging. With these new additions, we’re excited to announce the general availability of VM availability information in the HealthResources dataset in ARG! With this offering users can:
- Efficiently query the latest snapshot of VM availability across all Azure subscriptions at once and at low latencies for periodic and fleetwide monitoring.
- Accurately assess the impact to fleetwide business SLAs and quickly trigger decisive mitigation actions, in response to disruptions and type of failure signature.
- Set up custom dashboards to supervise the comprehensive health of applications by joining VM availability information with additional resource metadata present in ARG.
- Track relevant changes in VM availability across a rolling 14-day window, by using the change-tracking mechanism for conducting detailed investigations.
Getting started
Users can query ARG via PowerShell, REST API, Azure CLI, or even the Azure Portal. The following steps detail how data can be accessed from Azure Portal.
- Once on the Azure Portal, navigate to Resource Graph Explorer which will look like the below image:
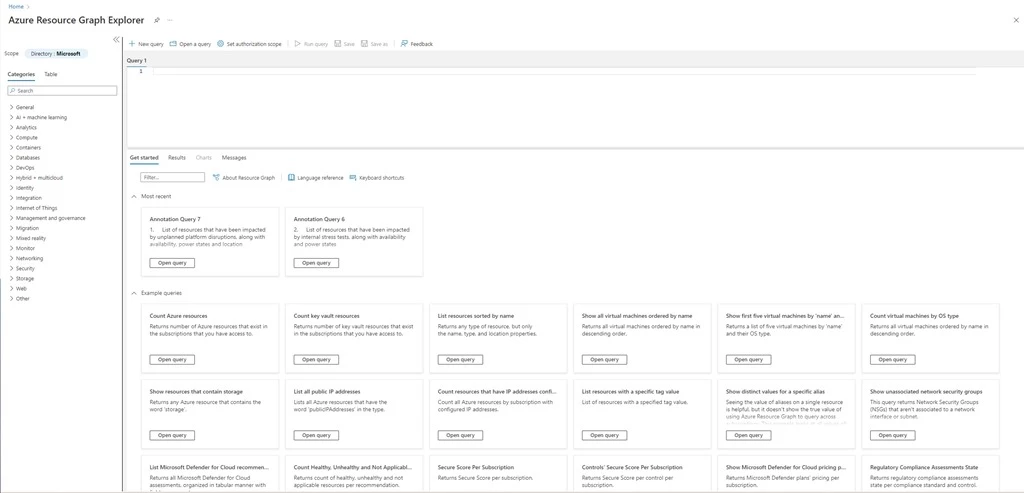
Figure 1: Azure Resource Graph Explorer landing page on Azure Portal.
- Select the Table tab and (single) click on the HealthResources table to retrieve the latest snapshot of VM availability information (availability state and health annotations).
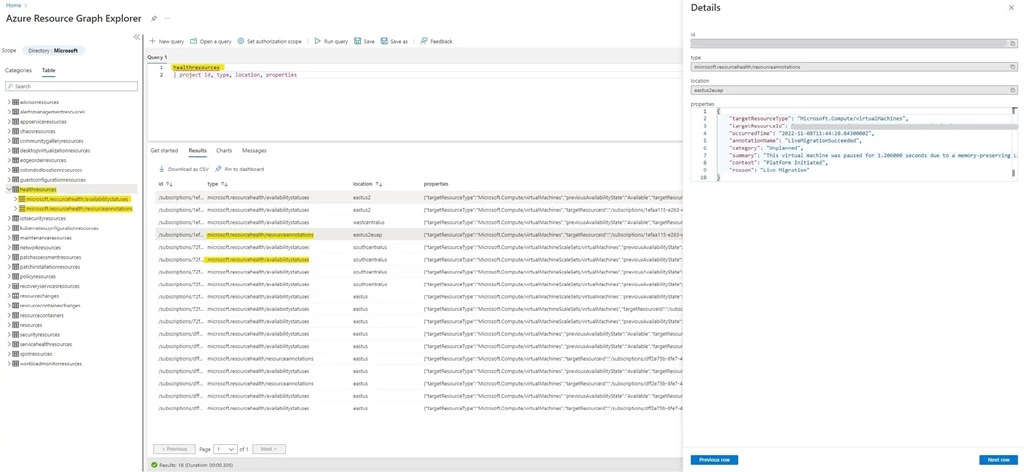
Figure 2: Azure Resource Graph Explorer Window depicting the latest VM availability states and VM health annotations in the HealthResources table.
There will be two types of events populated in the HealthResources table:
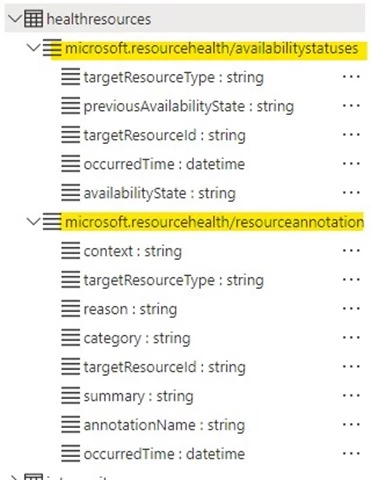
Figure 3: Snapshot of the type of events present in the HealthResources table, as shown in Resource Graph Explorer on the Azure Portal.
-
microsoft.resourcehealth/availabilitystatuses
This event denotes the latest availability status of a VM, based on the health checks performed by the underlying Azure platform. Below are the availability states we currently emit for VMs:
- Available: The VM is up and running as expected.
- Unavailable: We’ve detected disruptions to the normal functioning of the VM and therefore applications will not run as expected.
- Unknown: The platform is unable to accurately detect the health of the VM. Users can usually check back in a few minutes for an updated state.
To poll the latest VM availability state, refer to the properties field which contains the below details:
Sample
{

      "targetResourceType": "Microsoft.Compute/virtualMachines",

      "previousAvailabilityState": "Available",

"targetResourceId": "/subscriptions//resourceGroups//providers/Microsoft.Compute/virtualMachines/",

      "occurredTime": "2022-10-11T11:13:59.9570000Z",

      "availabilityState": "Unavailable"

}
Property descriptions
|
Field |
Description |
Corresponding RHC field |
|
targetResourceType |
Type of resource for which health data is flowing |
resourceType |
|
targetResourceId |
Resource Id |
resourceId |
|
occurredTime |
Timestamp when the latest availability state is emitted by the platform |
eventTimestamp |
|
previousAvailabilityState |
Previous availability state of the VM |
previousHealthStatus |
|
availabilityState |
Current availability state of the VM |
currentHealthStatus |
Refer to this doc for a list of starter queries to further explore this data.
-
microsoft.resourcehealth/resourceannotations (NEWLY ADDED)
This event contextualizes any changes to VM availability, by detailing necessary failure attributes to help users investigate and mitigate the disruption as needed. See the full list of VM health annotations emitted by the platform.
These annotations can be broadly classified into three buckets:
- Downtime Annotations: These annotations are emitted when the platform detects VM availability transitioning to Unavailable. (For example, during unexpected host crashes, rebootful repair operations).
- Informational Annotations: These annotations are emitted during control plane activities with no impact to VM availability. (Such as VM allocation/Stop/Delete/Start). Usually, no additional customer action is required in response.
- Degraded Annotations: These annotations are emitted when VM availability is detected to be at risk. (For example, when failure prediction models predict a degraded hardware component that can cause the VM to reboot at any given time). We strongly urge users to redeploy by the deadline specified in the annotation message, to avoid any unanticipated loss of data or downtime.
To poll the associated VM health annotations for a resource, if any, refer to the properties field which contains the following details:
Sample
{

     "targetResourceType": "Microsoft.Compute/virtualMachines",                                                                                                                                                                        "targetResourceId": "/subscriptions//resourceGroups//providers/Microsoft.Compute/virtualMachines/",

     "annotationName": "VirtualMachineHostRebootedForRepair",

     "occurredTime": "2022-09-25T20:21:37.5280000Z",

     "category": "Unplanned",

     "summary": "We're sorry, your virtual machine isn't available because an unexpected failure on the host server. Azure has begun the auto-recovery process and is currently rebooting the host server. No  additional action is required from you at this time. The virtual machine will be back online after the reboot completes.",

     "context": "Platform Initiated",

     "reason": "Unexpected host failure"

}
Property descriptions
|
Field |
Description |
Corresponding RHC field |
|
targetResourceType |
Type of resource for which health data is flowing |
resourceType |
|
targetResourceId |
Resource Id |
resourceId |
|
occurredTime |
Timestamp when the latest availability state is emitted by the platform |
eventTimestamp |
|
annotationName |
Name of the Annotation emitted |
eventName |
|
reason |
Brief overview of the availability impact observed by the customer |
title |
|
category |
Denotes whether the platform activity triggering the annotation was either planned maintenance or unplanned repair. This field is not applicable to customer/VM-initiated events. Possible values: Planned | Unplanned | Not Applicable | Null |
category |
|
context |
Denotes whether the activity triggering the annotation was due to an authorized user or process (customer-initiated), or due to the Azure platform (platform-initiated) or even activity in the guest OS that has resulted in availability impact (VM initiated). Possible values: Platform-initiated | User-initiated | VM-initiated | Not Applicable | Null |
context |
|
summary |
Statement detailing the cause for annotation emission, along with remediation steps that can be taken by users |
summary |
Refer to this doc for a list of starter queries to further explore this data.
Looking ahead to 2023, we have multiple enhancements planned for the annotation metadata that is surfaced in the HealthResources dataset. These enrichments will give users access to richer failure attributes to decisively prepare a response to a disruption. In parallel, we aim to extend the duration of historical lookback to a minimum of 30 days so users can comprehensively track past changes in VM availability.
VM availability metric in Azure Monitor Preview
We’re excited to share that the out-of-box VM availability metric is now available as a public preview for all users! This metric displays the trend of VM availability over time, so users can:
Set up threshold-based metric alerts on dipping VM availability to quickly trigger appropriate mitigation actions.
Correlate the VM availability metric with existing platform metrics like memory, network, or disk for deeper insights into concerning changes that impact the overall performance of workloads.
Easily interact with and chart metric data during any relevant time window on Metrics Explorer, for quick and easy debugging.
Route metrics to downstream tooling like Grafana dashboards, for constructing custom visualizations and dashboards.
Getting started
Users can either consume the metric programmatically via the Azure Monitor REST API or directly from the Azure Portal. The following steps highlight metric consumption from the Azure Portal.
Once on the Azure Portal, navigate to the VM overview blade. The new metric will display as VM Availability (Preview), along with other platform metrics under the Monitoring tab.
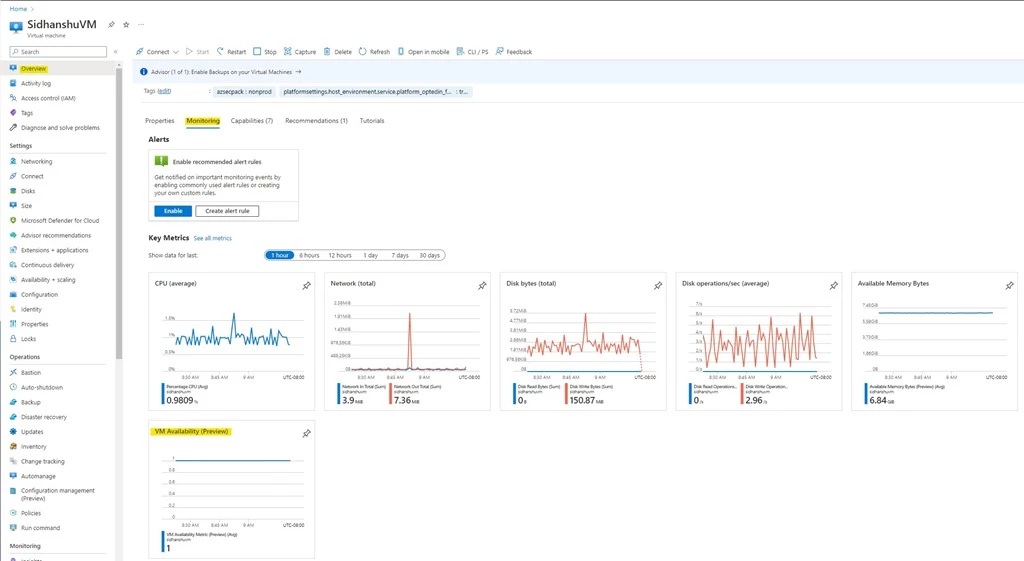
Figure 4: View the newly added VM Availability Metric on the VM overview page on Azure Portal.
Select (single click) the VM availability metric chart on the overview page, to navigate to Metrics Explorer for further analysis.
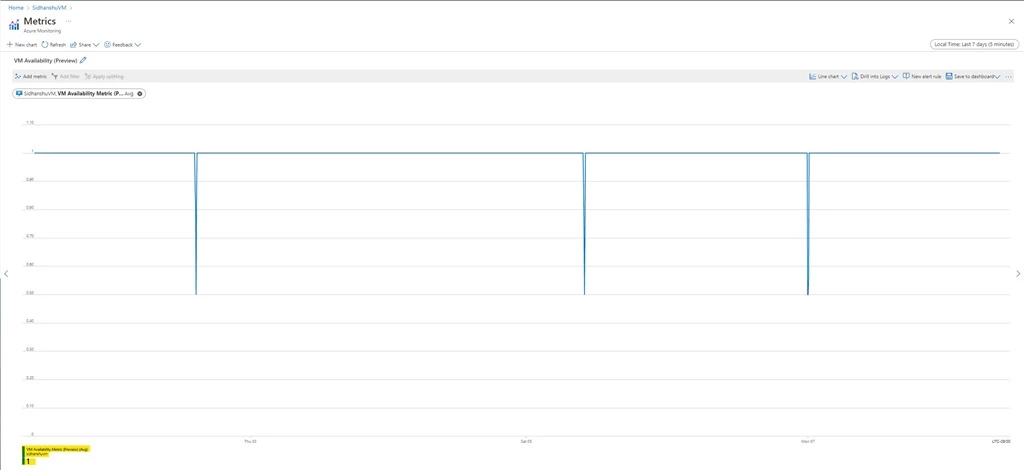
Figure 5: View the newly added VM availability Metric on Metrics Explorer on Azure Portal.
Metric description:
|
Display Name |
VM Availability (preview) |
|
Metric Values |
1 during expected behavior; corresponds to VM in Available state. 0 when VM is impacted by rebootful disruptions; corresponds to VM in Unavailable state. NULL (shows a dotted or dashed line on charts) when the Azure service that is emitting the metric is down or is unaware of the exact status of the VM; corresponds to VM in Unknown state. |
|
Aggregation |
The default aggregation of the metric is Average, for prioritized investigations based on extent of downtime incurred. The other aggregations available are: Min, to immediately pinpoint to all the times where VM was unavailable. Max, to immediately pinpoint to all the instances where VM was Available. Refer here for more details on chart range, granularity, and data aggregation. |
|
Data Retention |
Data for the VM availability metric will be stored for 93 days to assist in trend analysis and historical lookback. |
|
Pricing |
Please refer to the Pricing breakdown, specifically in the “Metrics” and “Alert Rules” sections. |
Looking ahead to 2023, we plan to include impact details (user vs platform initiated, planned vs unplanned) as dimensions to the metric, so users are well equipped to interpret dips, and set up much more targeted metric alerts. With the emission of dimensions in 2023, we also anticipate transitioning the offering to a general availability status.
Introducing instantaneous notifications on changes in VM availability via Event Grid
We’re thrilled to introduce our latest monitoring offering—the private preview of VM availability status change events in an Event Grid System Topic, which uses the low-latency technology of Azure Event Grid! Users can now subscribe to the system topic and route these events to their downstream tooling using any of the available event handlers (such as Azure Functions, Logic Apps, Event Hubs, and Storage queues). This solution uses an event-driven architecture to communicate scoped changes in VM availability to end users in less than five seconds from the disruption occurrence. This empowers users to take instantaneous mitigation actions to prevent end user impact.
As part of the private preview, we’ll emit events scoped to changes in VM availability states, with the sample schema below:
Sample
{

     "id": "4c70abbc-4aeb-4cac-b0eb-ccf06c7cd102",

     "topic": "/subscriptions/,

   "subject": "/subscriptions//resourceGroups//providers/Microsoft.Compute/virtualMachines//providers/Microsoft.ResourceHealth/AvailabilityStatuses/current",

    "data": {

        "resourceInfo": {

"id":"/subscriptions//resourceGroups//providers/Microsoft.Compute/virtualMachines//providers/Microsoft.ResourceHealth/AvailabilityStatuses/current",

"properties": {

"targetResourceId":"/subscriptions//resourceGroups//providers/Microsoft.Compute/virtualMachines/"

              "targetResourceType": "Microsoft.Compute/virtualMachines",

              "occurredTime": "2022-09-25T20:21:37.5280000Z"

"previousAvailabilityState": "Available",

      "availabilityState": "Unavailable"

           }

        },

        "apiVersion": "2020-09-01"

     },

"eventType": "Microsoft.ResourceNotifications.HealthResources.AvailabilityStatusesChanged",

   "dataVersion": "1",

     "metadataVersion": "1",

     "eventTime": "2022-09-25T20:21:37.5280000Z"

}
The properties field is fully consistent with the microsoft.resourcehealth/availabilitystatuses event in ARG. The event grid solution offers near-real-time alerting capabilities on the data present in ARG.
We’re currently releasing the preview to a small subset of users to rigorously test the solution and collect iterative feedback. This approach enables us to preview and even announce the general availability of a high quality and well-rounded offering in 2023. As we look towards the general availability of this solution, users can expect to receive events when annotations, automated RCAs are emitted by the platform.
What’s next?
We’ll be heavily focused on strengthening our monitoring platform to continuously improve the experience for customers based on ongoing feedback collected from the community (such as aggregated VMSS health showing degraded inaccurately, VM unavailable for 15 minutes, Missing VM downtimes in Activity Log). By streamlining our internal message pipeline, we aim to not only improve data quality, but also maintain data consistency across our offerings and expand the scope of failure scenarios surfaced.
Introducing Degraded VM Availability state
In light of our upcoming efforts to centralize our monitoring architecture, we’ll be well-positioned to introduce a Degraded VM availability state for virtual machines in 2023. This state will be extremely useful in setting up targeted alerts on predicted hardware failure scenarios where there is imminent risk to VM availability. This state will also allow users to efficiently track cases of degraded hardware or software failures needing to redeploy, which today do not cause a corresponding change in VM availability. We will also aim to emit reminder annotations through the duration of the VM being marked Degraded, to prevent users from overlooking the request to redeploy.
Expand scope of failure attribution to include application freeze events
In 2023, we plan to expand our scope of failure attribution and emission to also include application freeze events that may be caused due to network agent updates, host OS updates lasting thirty seconds and freeze-causing repair operations. This will ensure users have enhanced visibility into freeze impact and will be applied across our monitoring offerings, including Resource Health and Activity Logs.
Learn More
Please stay tuned for more announcements on the Flash initiative, by tracking updates to the Advancing Reliability Series!