We are excited to share the general availability of ExpressRoute monitoring with Network Performance Monitor (NPM). A few months ago, we announced ExpressRoute Monitor with NPM in public preview. Since then, we’ve seen lots of users monitor their Azure ExpressRoute private peering connections, and working with customers we’ve gathered a lot of great feedback. While we’re not done working to make ExpressRoute monitoring best in class, we’re ready and eager for everyone to get their hands on it. In this post, I’ll take you through some of the capabilities that ExpressRoute Monitor provides. To get started, watch a brief demo video explaining ExpressRoute monitoring capability in Network Performance Monitor.
Monitor connectivity to Azure VNETs, over ExpressRoute
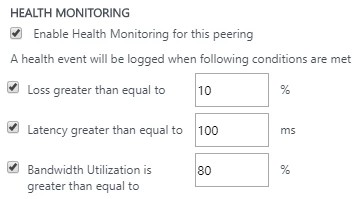
NPM can monitor the packet loss and network latency between your on-premises resources (branch offices, datacenters, and office sites) and Azure VNETs connected through an ExpressRoute. You can setup alerts to get proactively notified whenever the loss or latency crosses the threshold. In addition to viewing the near real-time values and historical trends of the performance data, you can use the network state recorder to go back in time to view particular network state in order to investigate the difficult-to-catch transient issues.
Get end-to-end visibility into the ExpressRoute connections
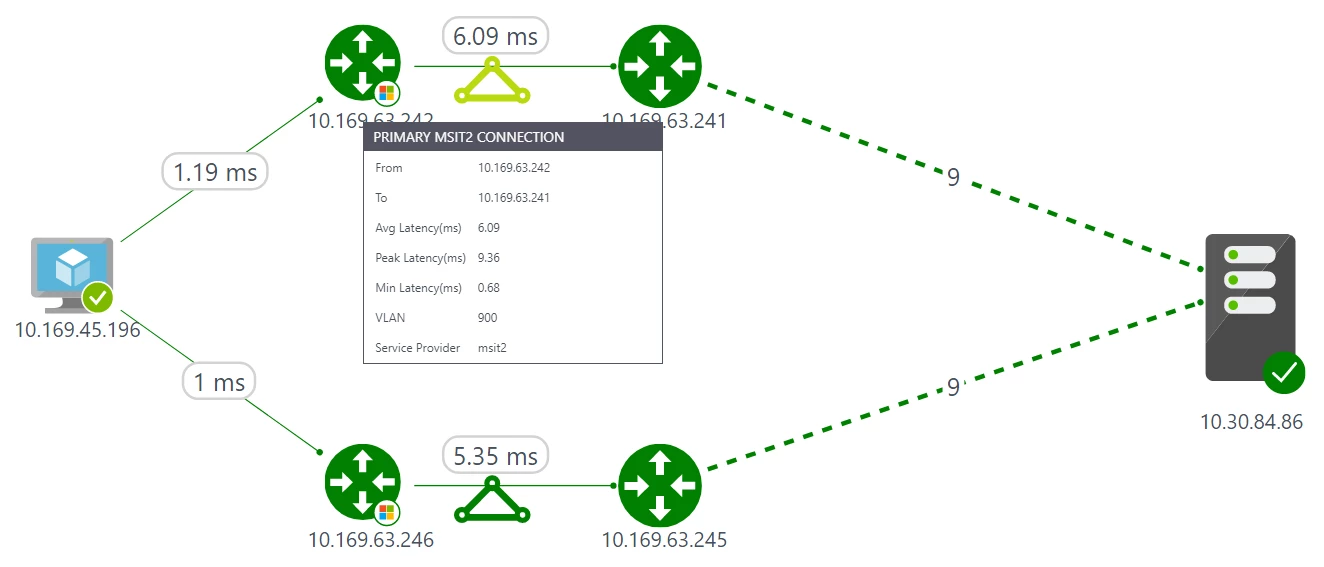
Since an ExpressRoute connection comprises of various components, it is extremely difficult to identify the bottleneck when high latency is experienced while connecting to an Azure workload. Now, you can get the required end-to-end visibility through NPM’s interactive topology view. You can not only view all the constituent components, your on-premises network, circuit provider edge, ExpressRoute circuit, Microsoft edge, and Azure VMs, but also the latency contributed by each hop to help you identify the troublesome segment.
The following snippet illustrates a topology view where the Azure VM on the left is connected to the on-premises VM on the right, over primary and secondary ExpressRoute connections. The Microsoft router at the Azure edge and the service provider router at the customer edge are also depicted. The nine on-premises hops (depicted by dashed lines) are initially compressed.

You can also choose to expand the map to view all the on-premises hops and understand the latency contributed by each hop.

Understand bandwidth utilization
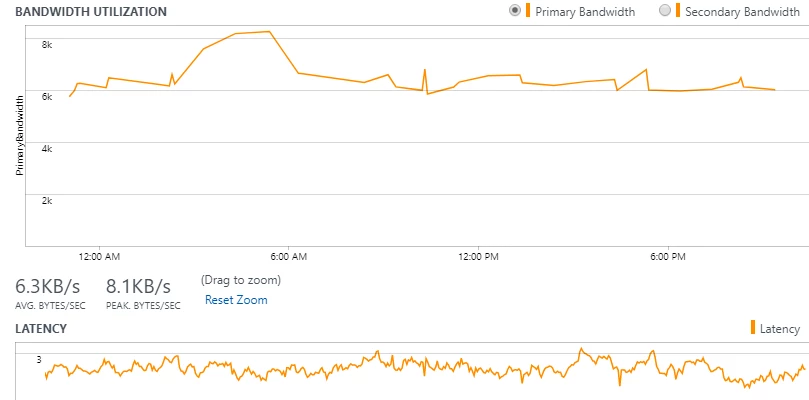
This capability lets you view the bandwidth utilization trends for both the primary and secondary ExpressRoute circuits, and as a result, helps you in capacity planning. Not only can you view the aggregated bandwidth utilization for all the private peering connections of the ExpressRoute circuit, but you can also drill-down to understand the bandwidth utilization trend for each VNET. This will help you identify the VNETs that are consuming most of your circuit bandwidth.

You can also setup alerts to notify when the bandwidth consumed by a VNET crosses the threshold.

Diagnose ExpressRoute connectivity issues
NPM helps you diagnose several circuit connectivity issues. Below are examples of possible issue.
Circuit is down – NPM notifies you as soon as the connectivity between your on-premises resources and Azure VNETs is lost. This will help you take proactive action before receiving user escalations and reduce the downtime.


Traffic not flowing through intended circuit – NPM can notify you whenever the traffic is unexpectedly not flowing through the intended ExpressRoute circuit. This can happen if the circuit is down and the traffic is flowing through the backup route, or if there is a routing issue. This information will help you proactively manage any configuration issues in your routing policies and ensure that the most optimal and secure route is used.

Traffic not flowing through primary circuit – The capability notifies you when the traffic is flowing through the secondary ExpressRoute circuit. Even though you will not experience any connectivity issues in this case, proactively troubleshooting the issues with the primary circuit will make you better prepared.


Degradation due to peak utilization – You can correlate the bandwidth utilization trend with the latency trend to identify whether the Azure workload degradation is due to a peak in bandwidth utilization, or not, and take action accordingly.

Create custom queries and views
All data that is exposed graphically through NPM’s UI are also available natively in Log Analytics search. You can perform interactive analysis of data in the repository, correlate data from different sources, create custom alerts and views, and export the data to Excel, PowerBI, or a shareable link.
Get started
To get started, see the detailed instructions on how to setup ExpressRoute Monitor in NPM and learn more about the other capabilities in NPM.
Please send your feedback
There are a few different routes to give feedback:
- UserVoice: Post new ideas for Network Performance Monitor on our UserVoice page.
- Join our cohort: We’re always interested in having new customers join our cohorts to get early access to new features and help us improve NPM going forward. If you are interested in joining our cohorts, simply fill out this quick survey.
