When you publish a Java web application, you want a clear view of what users are doing with it and how it’s performing. Your most effective plan for future work comes from a deep understanding of how people use what you’ve already provided: which features they like, what patterns they follow, and what they find difficult. You also want to know that your application is performing well – how quickly it responds, how performance varies under load. If performance drops or exceptions are thrown, you’d like to be notified quickly, and to diagnose the issue you’ll want powerful filter and search facilities to investigate the event traces.
Visual Studio Application Insights is a service that gives you all of this, with powerful usage analytics, performance monitoring and diagnostic analysis. To use it, you add an SDK to your application, which sends telemetry to the Application Insights web portal. There, you slice and dice your metrics and events and configure the alerts you need.
You can send telemetry from the server, from web pages, and from several types of client applications, such as Windows Phone and Windows Store Apps. The API is uniform across the different platforms. There’s also a web test service that pings your website at regular intervals to make sure it’s up and responding well.
This week at EclipseCon, we’re pleased to introduce the Application Insights SDK for Java. Here’s a typical plan for setting up Application Insights for your Java web application. Please note, you don’t have to adhere to this order:
|
Instrumentation you add | Insights you receive |
| Server insights: Add the SDK to your Java web application | Server-side metrics of response times, volumes of requests, numbers of users. Alerts on bad performance. |
| Client insights: Add the Application Insights script to your web pages | Page views, user and session counts, return rates and browser types. |
| Availability web tests | Chart response times, get alerts on outages. |
| Add custom telemetry – client-side, server-side, or both | Track how your application is being used by sending custom events, metrics and exceptions. |
| Add the Application Insights logging appender to your logging framework | Explore your application logs directly in the Application Insights portal with powerful slice and dice capabilities. |
What insights can I get for my Java application?
We’re constantly expanding the set of insights you can get for your java web app, to help you gain a complete 360° view of your application’s availability, performance and usage. Here’s what is available today:
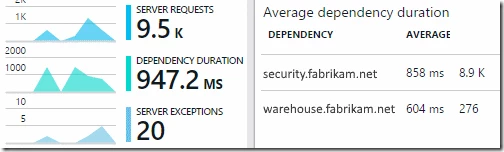
Monitor how your app performs – Make sure your application is performing well, and find out quickly about any failures. This information is retrieved automatically when adding the SDK to your web project.
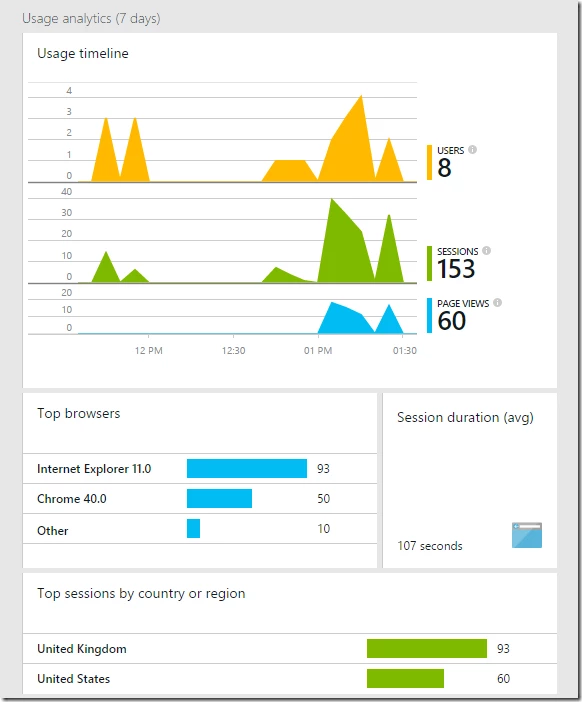
Analyze usage patterns in your application – Understand adoption, interaction and engagement trends. Insert a JavaScript snippet in your web pages to find out what pages draw most attention, what the profile of your users is, and where they spend most of their time in your app.
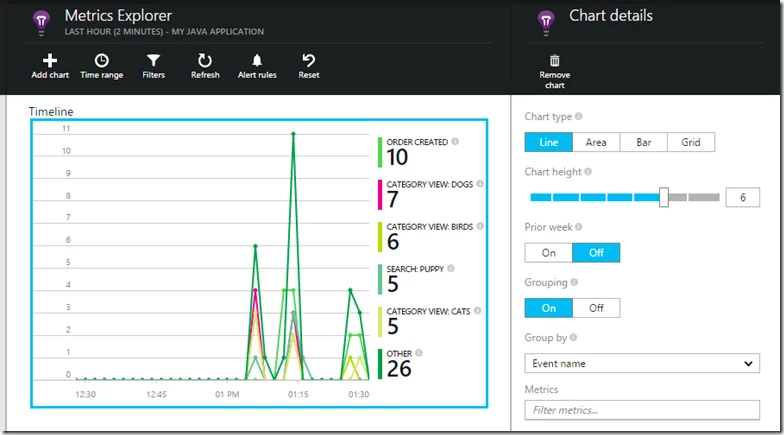
Track custom event, metric and exception telemetry – Using the telemetry API, insert a few lines of code in your application to find out what users are doing with it, or to help diagnose issues.
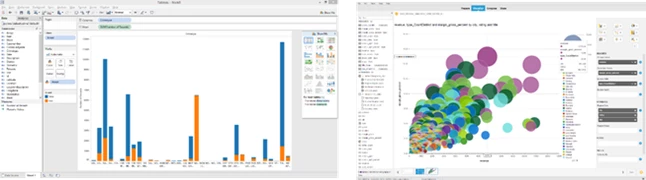
Explore your trace logs in the Application Insights portal – have your trace logs sent automatically to Application Insights where you can explore and search on them. Just add the Application Insights appender to your logging framework’s configuration (supported for Log4J and Logback).
Monitor the health of your application – After you’ve deployed your web application, you can set up web tests to monitor its availability and responsiveness. Application Insights will send web requests at regular intervals from points around the world, and can alert you if your application responds slowly or not at all.
Adding the Application Insights SDK for Java to your project
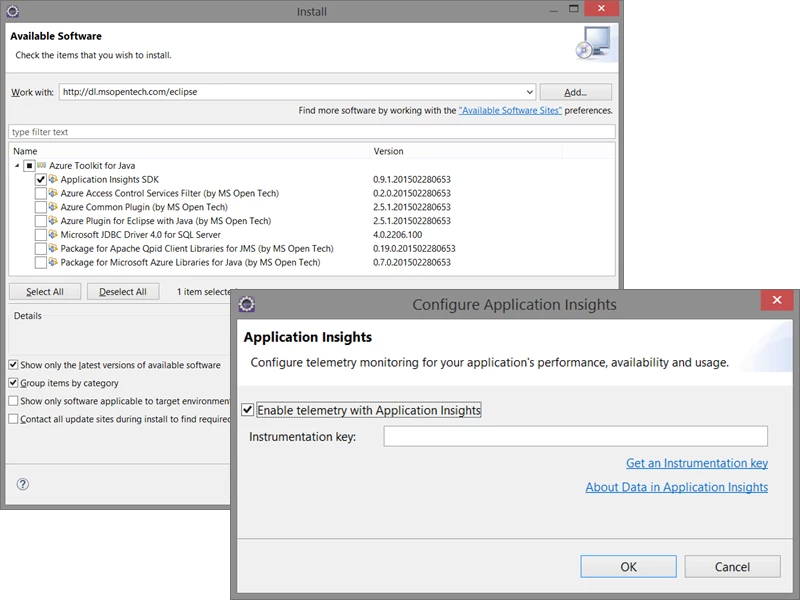
If you develop your project using Eclipse, adding the Application Insights SDK for Java to your dynamic web project is easy. All you need to do is install the newest version of the Azure Toolkit for Eclipse (By Microsoft Open Technologies) which will be available during the week of EclipseCon, right-click your project, select “Configure Application Insights”, and provide your instrumentation key. Step by step guide on how to do this.
There are a number of additional ways to add the SDK to your Java project: using Maven, Gradle, or manually. This article covers all these options in detail.
Can I use Visual Studio Online to plan, code, build, test and deploy my Java applications?
Absolutely, Visual Studio Online provides cloud-hosted tools for your Java teams that complement your favorite Java tools and services such as Eclipse and Jenkins, respectively.
What’s next?
Now that you’ve added the SDK to your project, you can go ahead and add more instrumentation to gain a variety of insights about your Java application.
Here are some links to get you started:
- Track usage of web applications – add a script to your web pages to track page views, users and sessions
- Explore Java trace logs in Application Insights – capture logs from your favorite logging framework so you can slice and dice along with request and page view events
- Write custom telemetry with Application Insights API – track what people do with your app
- Monitor any web site’s availability and responsiveness – set up web tests
- Track HTTP requests in a Java web application – view information about the HTTP requests sent to your application
What do you think?
We’d love to get your feedback. How can we make this better? Please let us know!