As we head into the fourth calendar year of the Advancing Reliability blog series, empowering organizations to run their workloads reliably on Azure remains one of our top priorities. We continually invest in evolving the Azure platform to help achieve this on a daily basis. Your ability to monitor virtual machine (VM) availability in a robust and comprehensive way is paramount to ensuring that your applications are available and resilient. For today’s post in the series, I have asked Program Manager, Pujitha Desiraju, from our Azure Core Platform Fundamentals Engineering team to talk about the latest observability enhancements for VM availability monitoring, as well as planned investments to deliver the best monitoring experience.”—Mark Russinovich, CTO, Azure
This post was co-authored by Principal Software Engineering Manager, Gaurav Jagtiani.
Flash, as the project is internally known, is a collection of efforts across Azure Engineering, that aims to evolve Azure’s virtual machine (VM) availability monitoring ecosystem into a centralized, holistic, and intelligible solution customers can rely on to meet their specific observability needs. Today, we’re excited to announce the completion of the project’s first two milestones—the preview of VM availability data in Azure Resource Graph, and the private preview of a VM availability metric in Azure Monitor.
What is Project Flash?
Project Flash derives its name from our commitment to building robust and rapid ways to monitor virtual machine (VM) availability as comprehensively as possible—a key prerequisite for efficient application performance. It’s our mission to ensure you can:
- Consume accurate and actionable data on VM availability disruptions (for example, VM reboots and restarts, application freezes due to network driver updates, and 30-second host OS updates), along with precise failure details (for example, platform versus user-initiated, reboot versus freeze, planned versus unplanned).
- Analyze and alert on trends in VM availability for quick debugging and month-over-month reporting.
- Periodically monitor data at scale and build custom dashboards to stay updated on the latest availability states of all resources.
- Receive automated root cause analyses (RCAs) detailing impacted VMs, downtime cause and duration, consequent fixes, and similar—all to enable targeted investigations and post-mortem analyses.
- Receive instantaneous notifications on critical changes in VM availability to quickly trigger remediation actions and prevent end-user impact.
- Dynamically tailor and automate platform recovery policies, based on ever-changing workload sensitivities and failover needs.
With these goals in mind, we’ve divided our execution strategy into two phases—a near-term phase to meet critical current needs, and a long-term phase to deliver the best VM availability monitoring experience. This two-phased approach helps us continually bridge gaps, iterate on service quality, and learn from your feedback at every step along the way.
Announcing new monitoring options
For the first phase, we are providing different options to enable convenient access to VM availability data to address a range of observability needs. We aim to maintain data consistency with similar rigorous quality standards across all of these existing features and solutions, like Resource Health or Activity Log, to deliver a consistent view agnostic of the solution you choose.
Introducing at-scale analysis for VM availability
Today, we’re excited to reach our first Project Flash milestone—with the preview release of VM availability states in Azure Resource Graph for at-scale programmatic consumption.
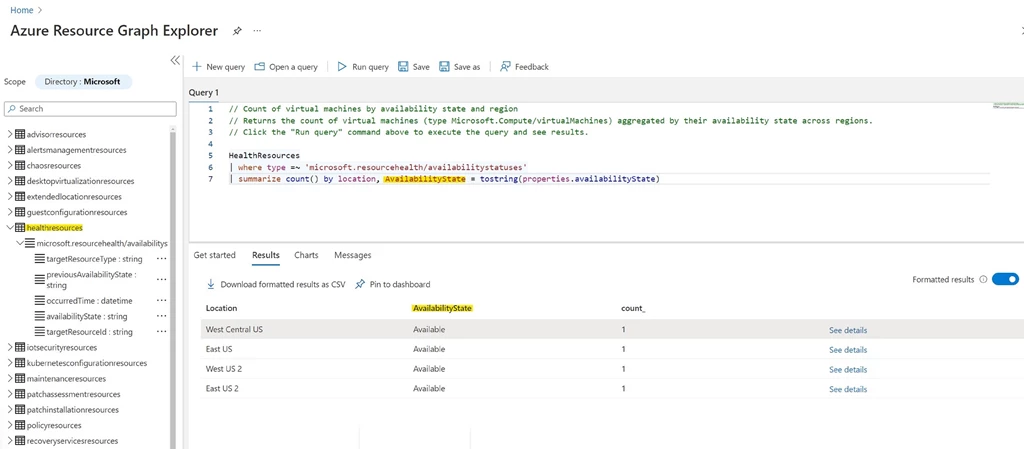
Azure Resource Graph is a service in Azure that is extensively adopted for its efficient ability to query across many subscriptions, all at once and at low latencies. We’re currently emitting VM availability states (Available, Unavailable, and Unknown) to the Health Resources table in Azure Resource Graph, so you can perform complex Kusto Query Language (KQL) queries for sieving through large datasets at once. This functionality is handy for tracking historical changes in VM availability, for building custom dashboards, and for performing detailed investigations across numerous resource properties spread across multiple tables.

Figure 1: Azure Resource Graph Explorer Window with query and results, to demonstrate fetching data from the HealthResources table.
We are planning to add failure details and degraded VM scenarios to the Health Resources table in Azure Resource Graph, later this year. These details will ensure you are properly informed on the cause and impact of any failures—so you can either failover, reboot in place, or take the appropriate mitigations to prevent end-user impact.
Navigate to Azure Resource Graph Explorer on the Azure portal to get started with any of the KQL queries published for the Health Resources table.
Introducing VM availability metric in Azure Monitor
We’re also pleased to announce the private preview of an out-of-box VM availability metric in Azure Monitor, for a curated metric alerting and monitoring experience.
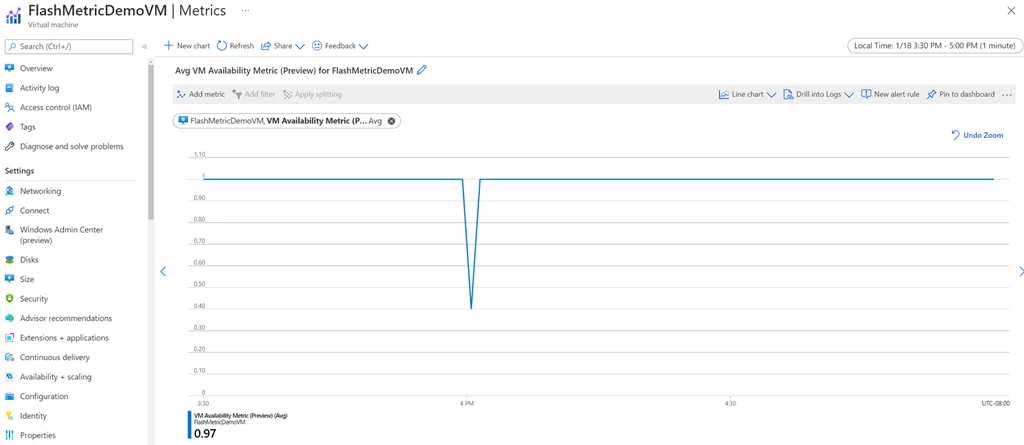
Metrics in Azure Monitor are great for monitoring and analyzing time series representations of VM availability for quick and easy debugging, receiving scoped alerts on concerning trends, catching early indicators of degraded availability, correlating with other platform metrics, and more.
The metric allows you to track the pulse of your VMs—during expected behavior, the metric displays a value of 1. In response to any VM availability disruptions, the metric dips to a 0 for the duration of impact. In case of an Azure infrastructure outage, we will emit nulls represented as a dotted line on the portal.

Figure 2: Screenshot of VM availability metric as seen on Metrics Explorer in the Azure portal, with occasional dips to reflect VM availability disruptions.
We released the private preview of the metric as phase one of our rollout plan, and are currently collecting customer feedback, to further improve our offering. We are planning to add failure details such as metric dimensions and platform logs next year, to allow you to precisely alert on failure scenarios that are impactful.
Coming soon
The two monitoring options introduced above are just the beginning for Project Flash! We will continue to build upon our existing solutions by improving data quality and failure attribution. In parallel, we are designing two new monitoring offerings to meet your latency and mitigation needs, while also investing heavily in the underlying platform to make our fault detection more resilient and comprehensive.
Azure Event Grid for instantaneous notifications
Successfully running business-critical applications requires hyper-awareness of any VM availability impacting event, so remediation actions can be triggered instantaneously to prevent end-user impact. To support you in your daily operations, we are planning to design a notification mechanism that leverages the low-latency technology of Azure Event Grid. This will allow you to simply subscribe to an Event Grid system topic, and route scoped events via event handlers to any downstream tooling, instantaneously.
Automate and tailor platform recovery policies
Considering the numerous ongoing investments to improve your VM availability monitoring experience, Project Flash intends to empower you even further by providing you knobs to customize recovery policies triggered by the platform, in response to cases of VM availability disruptions.
One such knob we are designing is the ability to opt-out of Service Healing for single-instance VMs, in response to a specific set of unanticipated Availability disruptions. This knob will be made available via the portal or at the time of VM deployment and can be updated dynamically. Note that leveraging this feature will render the usual Azure Virtual Machine availability SLAs ineffective.
In the future, we will explore introducing knobs to also opt-out of other applicable recovery policies (for example, Live Migration or Tardigrade), to ensure you can easily adapt to your ever-changing mitigation needs.
Ongoing platform quality investments
While the first phase is designed to meet your current observability needs, we remain focused on our long-term goal of delivering a world-class observability experience surrounding VM availability. We are extremely excited for all the data enrichments and technology advancements that will contribute to this experience, so here’s an early look at our roadmap of planned investments:
- Fault detection and attribution: We are continuously evolving our underlying infrastructure to detect and attribute failures both precisely and instantaneously—so that we can reduce unknown or missing health status reports, emit actionable failure details, and handle platform recovery customizations. This remains our top investment area on which we continue to iterate every cycle.
- Root cause analysis (RCA) automation: We are planning to implement easy tracking mechanisms for every unique VM downtime, along with automatic construction and emission of detailed downtime RCA statements to reduce manual tracking and churn on your end.
- AIOps integration: We are looking to leverage the tremendous advancements being made in AIOps across Microsoft, for enabling smart insights and anomaly detection and diagnosis across the multitude of data points on VM Availability.
- Centralized and cohesive user experience: We acknowledge that a consequence of our near-term approach is that across our different services we have multiple monitoring, alerting, and recovery tools which may lead to a confusing and disparate experience for you. This is a problem we intend to solve with our final phase. Our north star goal is to provide end-users access to distinct and necessary representations of VM availability, consolidated within Azure Monitor, and categorized according to common usage patterns for discoverability, ease of use and intuitive onboarding.
Learn more
This list is certainly not exhaustive as we have multiple enrichments planned as part of our long-term strategy. To reiterate, our intention with Project Flash is to make VM availability monitoring extremely intuitive, comprehensive, and seamless—so you are always prepared for and informed about any changes in the health of your workloads, ultimately to maintain your own SLAs and business promises.
We will continue to share updates on Project Flash through blogs like this, to ensure you stay up to date on the latest. Stay tuned!
