
As cloud services continue to scale, their impact on the environment cannot be overlooked. That’s why today we’re announcing the general availability of the Microsoft Emissions Impact Dashboard, a tool that helps Microsoft cloud customers understand, track, report, analyze, and reduce carbon emissions associated with their cloud usage. The Emissions Impact Dashboard is part of our commitment to address our own environmental impact and help our customers do the same.
We introduced the Emissions Impact Dashboard in January 2020 as the Microsoft Sustainability Calculator. Designed to help customers gather meaningful, shareable information, the Emissions Impact Dashboard gleans critical insights to help organizations make more informed, data-driven decisions about sustainable computing.
The Emissions Impact Dashboard provides transparency into greenhouse gas emissions associated with using Microsoft cloud services and enables a better understanding of the root causes of emissions changes. Organizations can measure the impact of Microsoft cloud usage on their carbon footprint, and they can drill down into emissions by month, service, and datacenter region. The tool also enables customers to enter un-migrated workloads and get an estimate of emissions savings from migrating to the Microsoft cloud. Newly added data protection allows Emissions Impact Dashboard administrators within an organization to control who can see their company data in the tool.
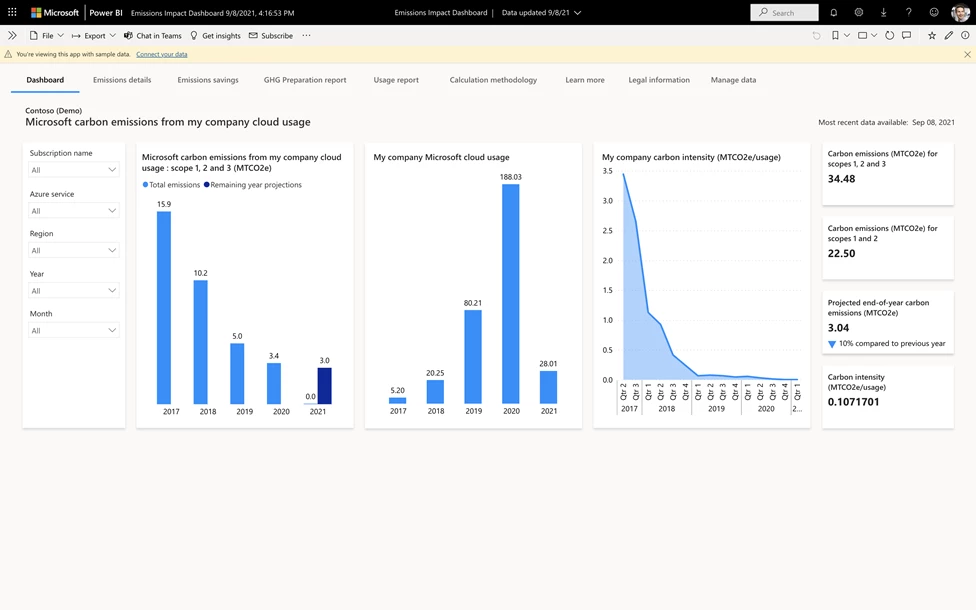
Figure 1: The main dashboard focuses on showcasing overall emissions and usage over time, as well as carbon intensity, which is a metric of carbon efficiency specific to cloud usage.
Expanded visibility into the impact of cloud usage
Over the past year, we’ve strengthened features in the Emissions Impact Dashboard, such as the calculation of Scope 3 emissions associated with Microsoft cloud usage. These emissions are indirect and occur across the product value chain—from materials extraction and manufacturing to transport, usage, and hardware disposal.
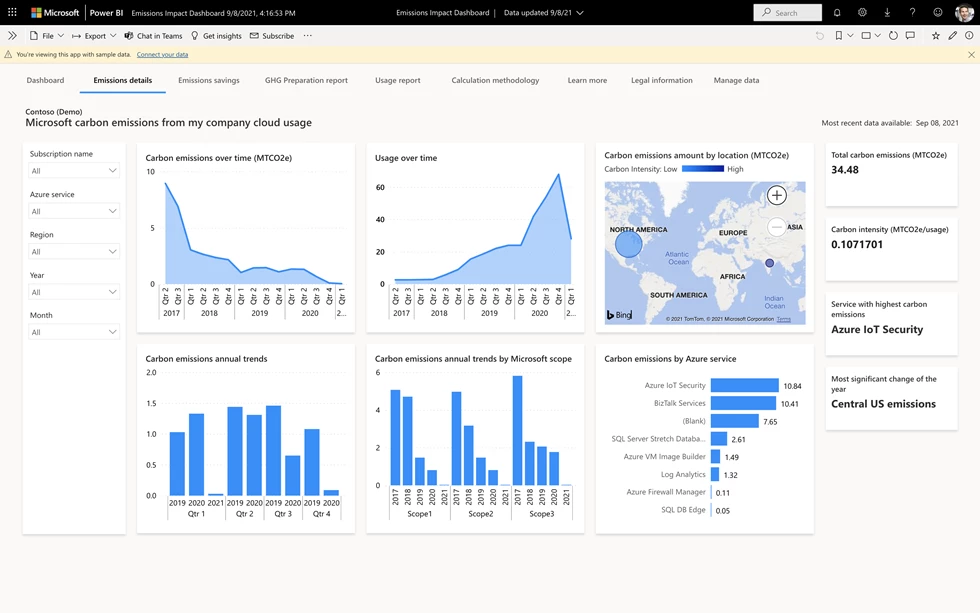
Figure 2: The dashboard shows carbon emissions by scope, year over year, helping organizations track trends and make impactful decisions about their cloud services usage.
Scope 3 activities are often the largest source of emissions, but they can be difficult to measure. Using our third-party validated methodology for carbon accounting, the Emissions Impact Dashboard provides a broad understanding of the carbon impact of cloud workloads across scopes. This allows for more complete and accurate emissions reporting and better decisions about sustainability.
RELX, the information and analytics group, has been using the Emissions Impact Dashboard during preview for the last six months. Sustainability is a priority for RELX, and the tool now forms one of the key components of its CO2.Hub, the Azure-based solution it has built using Power BI to measure its Scope 1, 2, and 3 emissions.
Another organization that’s successfully using the Emissions Impact Dashboard is The Bühler Group, a leading developer of grains and food solutions, consumer foods, and advanced materials that contribute to the production of energy-efficient vehicles and buildings. To reach its goal of becoming carbon neutral by 2030, Bühler saw the need to track Scopes 1, 2, and 3 emissions. With the Emissions Impact Dashboard, Bühler has determined Scope 3 emissions associated with its Microsoft cloud services in a format that’s easy to track and compile, adding to a more accurate view of their overall Scope 3 emissions.
Digital event: What’s Next for Sustainability
Microsoft continues to innovate in its efforts to help organizations take control of their sustainability goals with solutions like Microsoft Cloud for Sustainability. Join us on October 27 to learn more about how Microsoft Cloud for Sustainability will help organizations record, report, and reduce their end-to-end environmental footprint. Register at What’s Next for Sustainability. You can also stay informed about Microsoft sustainability news and initiatives by signing up today.