In October 2018 we announced the public preview of Azure Monitor for Virtual Machines (VMs). At that time, we included support for monitoring your virtual machine scale sets from the at scale view under Azure Monitor.
Today we are announcing the public preview of monitoring your Windows and Linux VM scale sets from within the scale set resource blade. This update includes several enhancements:
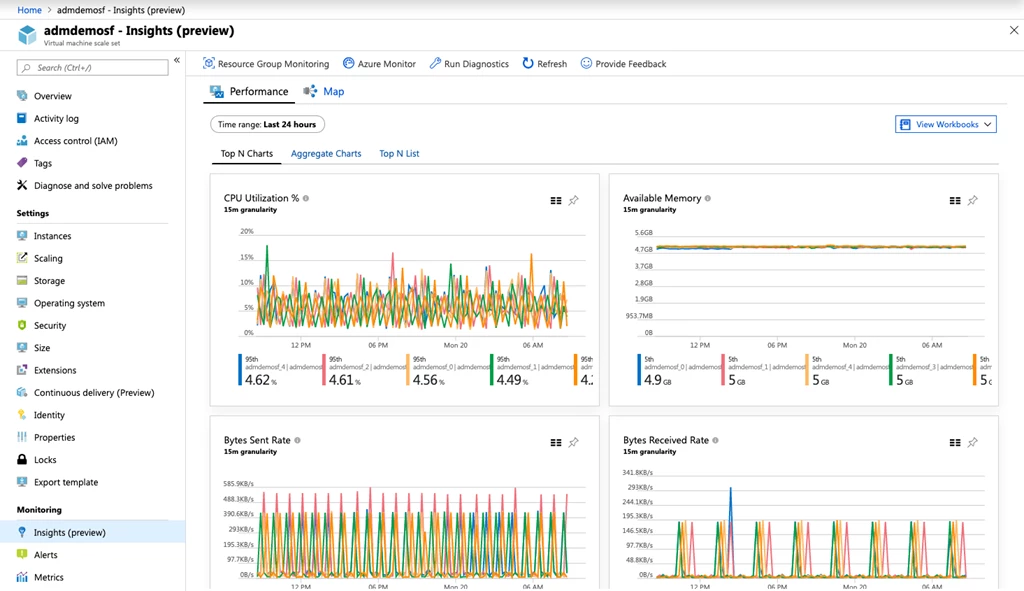
- In-blade monitoring for your scale set with “Top N”, aggregate, and list views across the entire scale set.
- Drill down experience to identify issues on a particular scale set instance.
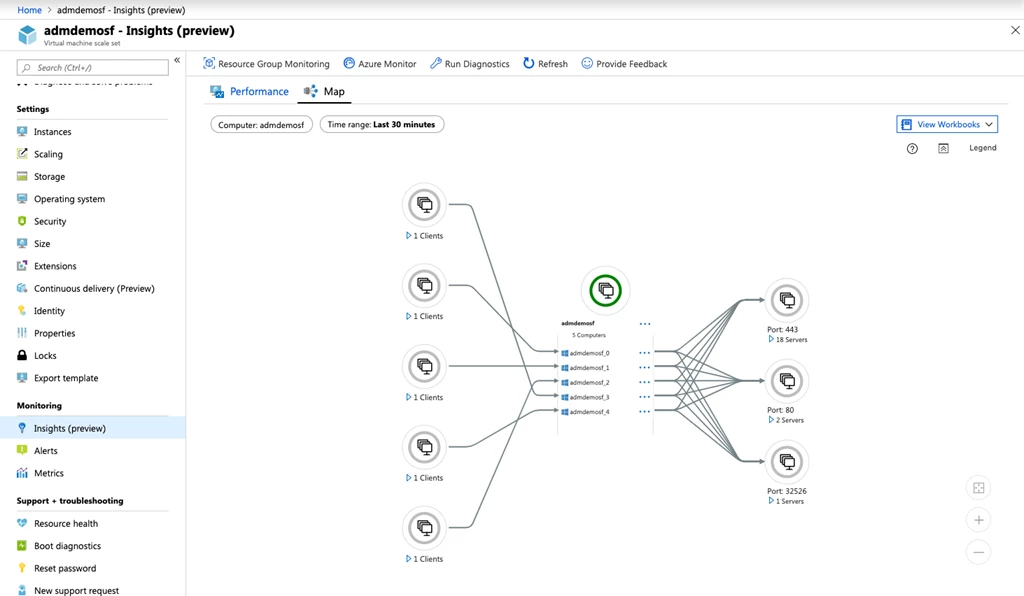
- Updated mapping UI to display the entire dependency diagram across your scale set while supporting drill down maps for a single instance.
- UI based enablement of monitoring from the scale set resource blade.
- Updated examples for enabling monitoring using Azure Resource Manager templates.
- Use of policy to enable monitoring for your scale set.
Performance
The performance views are powered using log analytics queries, offering “Top N”, aggregate, and list views to quickly find outliers or issues in your scale set based on guest level metrics for CPU, available memory, bytes sent and received, and logical disk space used.
These views will help you quickly determine if a particular instance is having an issue, and provide the means to troubleshoot the issue, specified down to the process that is having a failed connection to a backend service or a particular logical disk running out of space.
Maps
Our dependency maps and network connection data sets are powered by the service map solution and it’s Azure Virtual Machine extension. Maps in this context deliver a view that is specific to your scale set, automatically discovering the processes on the instances that are accepting in bound connections and making out bound connections to backend servers. This allows you to identify surprise dependencies to third party services, monitor failed connections, see live connection counts, monitor bytes sent and received per process, and identify service level latency.
In addition to the map view, you can analyze the network connection data set in our connections overview workbook or directly in log analytics.
Workbooks
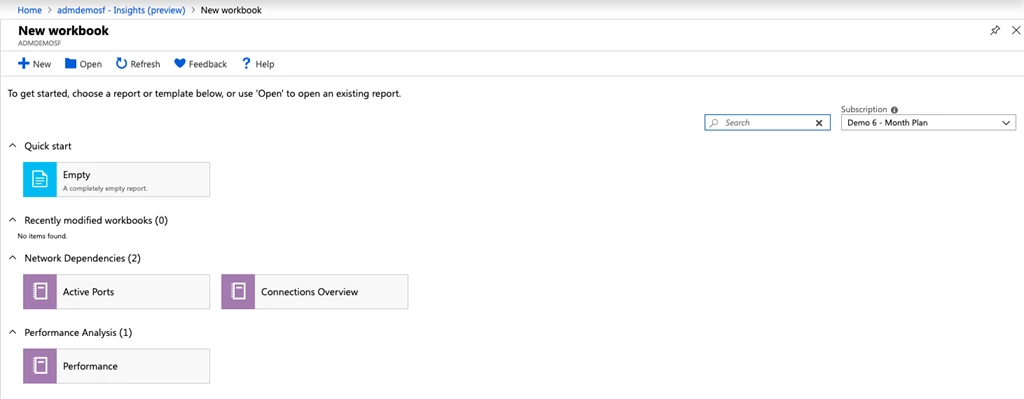
We have brought our workbooks from Azure Monitor for Virtual Machines to the scale set view. These workbooks query the monitoring data we collect and allow you to modify them to create custom reports that you can share with colleagues in the portal.
Getting started
If you’re running VM scale sets you can use the performance and map capabilities from the “Insights (preview)” menu on the scale set resource blade to find resource constraints and visualize dependencies.
To get started, go to the resource blade for your VM scale set and click on “Insights (preview)” in the monitoring section. When you click “Try now” you’ll be prompted to choose a log analytics workspace, or we can generate one for you. You can view your resources at scale in Azure Monitor under “Virtual Machines (preview)” and on-board to entire resource groups and subscriptions using Azure Policy or using Powershell.