Anomaly detection plays a vital role in many industries across the globe, such as fraud detection for the financial industry, health monitoring in hospitals, fault detection and operating environment monitoring in the manufacturing, oil and gas, utility, transportation, aviation, and automotive industries.
Anomaly detection is about finding patterns in data that do not conform to expected behavior. It is important for decision-makers to be able to detect them and take proactive actions if needed. Using the oil and gas industry as one example, deep-water rigs with various equipment are intensively monitored by hundreds of sensors that send measurements in various frequencies and formats. Analysis or visualization is hard using traditional software platforms, and any non-productive time on deep-water oil rig platforms caused by the failure to detect anomaly could mean large financial losses each day.
Companies need new technologies like Azure IoT, Azure Stream Analytics, Azure Data Explorer and machine learning to ingest, processes, and transform data into strategic business intelligence to enhance exploration and production, improve manufacturing efficiency, and ensure safety and environmental protection. These managed services also help customers dramatically reduce software development time, accelerate time to market, provide cost-effectiveness, and achieve high availability and scalability.
While the Azure platform provides lots of options for anomaly detection and customers can choose the technology that best suits their needs, customers also brought questions to field facing architects on what use cases are most suitable for each solution. We’ll examine the answers to these questions below, but first, you’ll need to know a couple definitions:
What is a time series? A time series is a series of data points indexed in time order. In the oil and gas industry, most equipment or sensor readings are sequences taken at successive points in time or depth.
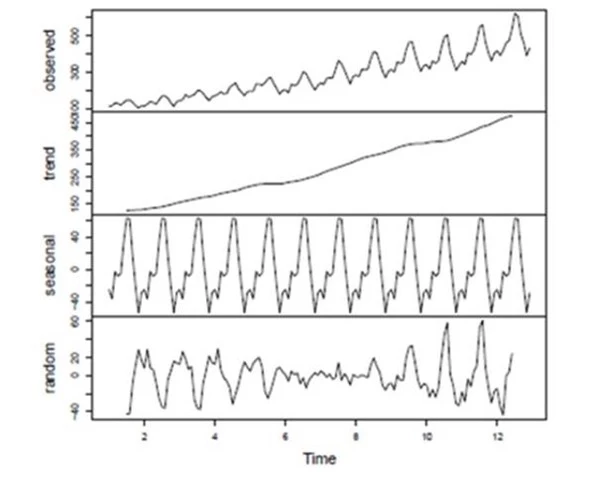
What is decomposition of additive time series? Decomposition is the task to separate a time series into components as shown on the graph below.

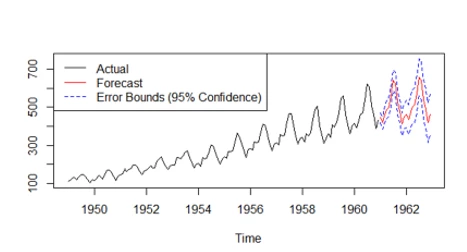
Time-series forecasting and anomaly detection

Anomaly detection is the process to identify observations that are different significantly from majority of the datasets.

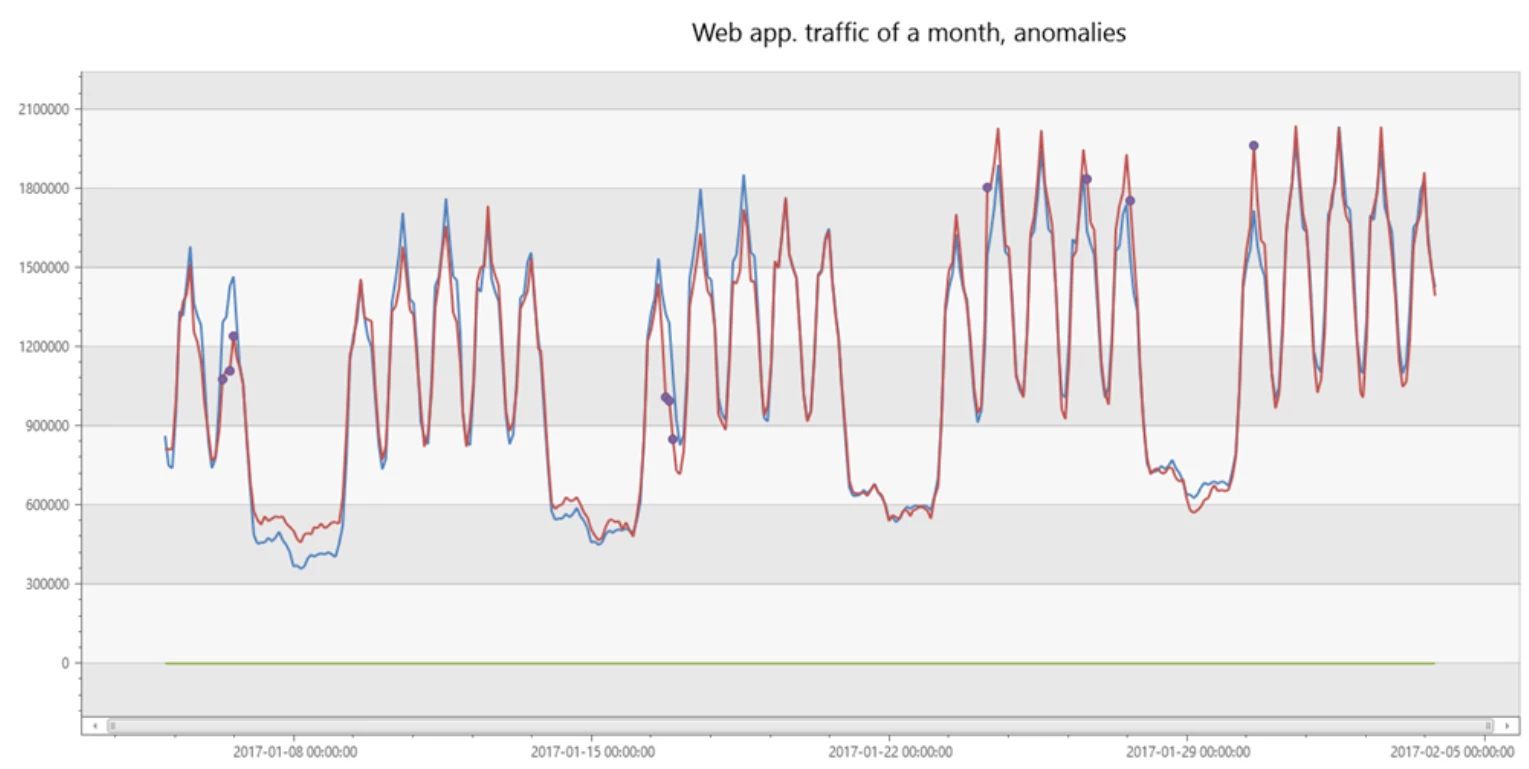
This is an anomaly detection example with Azure Data Explorer.
- The red line is the original time series.
- The blue line is the baseline (seasonal + trend) component.
- The purple points are anomalous points on top of the original time series.
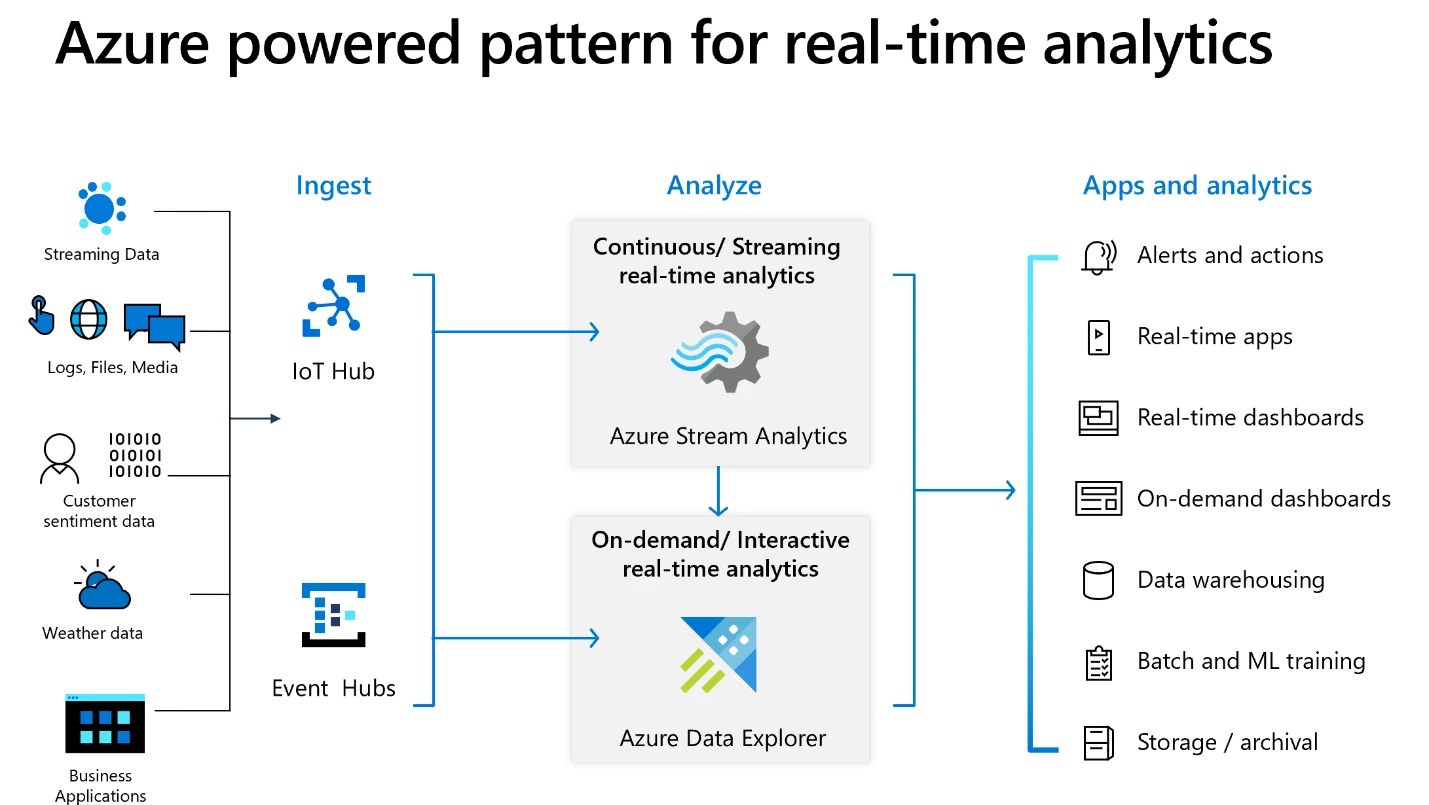
To detect anomalies, either Azure Stream Analytics or Azure Data Explorer can be used for real-time analytics and detection as illustrated in the diagram below.

Azure Stream Analytics is an easy-to-use, real-time analytics service that is designed for mission-critical workloads. You can build an end-to-end serverless streaming pipeline with just a few clicks, go from zero to production in minutes using SQL, or extend it with custom code and built-in machine learning capabilities for more advanced scenarios.
Azure Data Explorer is a fast, fully managed data analytics service for near real-time analysis on large volumes of data streaming from applications, websites, IoT devices, and more. You can ask questions and iteratively explore data on the fly to improve products, enhance customer experiences, monitor devices, boost operations, and quickly identify patterns, anomalies, and trends in your data.
Azure Stream Analytics or Azure Data Explorer?
Use Case
Stream Analytics is for continuous or streaming real-time analytics, with aggregate functions support hopping, sliding, tumbling, or session windows. It will not suit your use case if you want to write UDFs or UDAs in languages other than JavaScript or C#, or if your solution is in a multi-cloud or on-premises environment.
Data Explorer is for on-demand or interactive near real-time analytics, data exploration on large volumes of data streams, seasonality decomposition, ad hoc work, dashboards, and root cause analyses on data from near real-time to historical. It will not suit you use case if you need to deploy analytics onto the edge.
Forecasting
You can set up a Stream Analytics job that integrates with Azure Machine Learning Studio.
Data Explorer provides native function for forecasting time series based on the same decomposition model. Forecasting is useful for many scenarios like preventive maintenance, resource planning, and more.
Seasonality
Stream Analytics does not provide seasonality support, with the limitation of sliding windows size.
Data Explorer provides functionalities to automatically detect the periods in the time series or allows you to verify that a metric should have specific distinct period(s) if you know them.
Decomposition
Stream Analytics does not support decomposition.
Data Explorer provides function which takes a set of time series and automatically decomposes each time series to its seasonal, trend, residual, and baseline components.
Filtering and Analysis
Stream Analytics provides functions to detect spikes and dips or change points.
Data Explorer provides analysis to finds anomalous points on a set of time series, and a root cause analysis (RCA) function after anomaly is detected.
Filtering
Stream Analytics provides a filter with reference data, slow-moving, or static.
Data Explorer provides two generic functions:
• Finite impulse response (FIR) which can be used for moving average, differentiation, shape matching
• Infinite impulse response (IIR) for exponential smoothing and cumulative sum
Anomaly Detection
Stream Analytics provides detections for:
• Spikes and dips (temporary anomalies)
• Change points (persistent anomalies such as level or trend change)
Data Explorer provides detections for:
• Spikes & dips, based on enhanced seasonal decomposition model (supporting automatic seasonality detection, robustness to anomalies in the training data)
• Changepoint (level shift, trend change) by segmented linear regression
• KQL Inline Python/R plugins enable extensibility with other models implemented in Python or R
What’s next?
Azure Data Analytics, in general, brings you the best of breed technologies for each workload. The new Real-Time Analytics architecture (shown above) allows leveraging the best technology for each type of workload for stream and time-series analytics including anomaly detection. The following is a list of resources that may help you get started quickly:
-
If you haven’t already, check out this GitHub repository for Anomaly detection in Azure Stream Analytics
-
Check out his GitHub repository for Anomaly detection and forecasting in Azure Data Explorer, and Time series analysis in Azure Data Explorer.
-
Anomaly detection and forecasting in Azure Data Explorer Overview
-
Documentation on Time series analysis in Azure Data Explorer and this blog
-
Documentation on Kusto query language and Time Series Analysis
