At Ignite 2018, we shared the vision to bring monitoring infrastructure, applications, and the network into one unified offering, providing full stack monitoring for your applications. Over last few months, individual capabilities such as Application Insights and Azure Monitor logs have come together to provide a seamless and integrated Azure Monitor experience.
We’d like to share our three favorites:
- End-to-end monitoring for Azure Kubernetes Service
- Integrated access control for logs
- Intelligent scalable alerts
End-to-end monitoring for Azure Kubernetes Service
Today, Azure Kubernetes Service (AKS) customers rely on Azure Monitor for containers to get out of the box monitoring for the AKS clusters. Kubernetes event logs are now available in real-time in addition to live container logs. You can now filter the charts and metrics for specific AKS node pools and see Node Storage Capacity metrics when you drill down into node details.
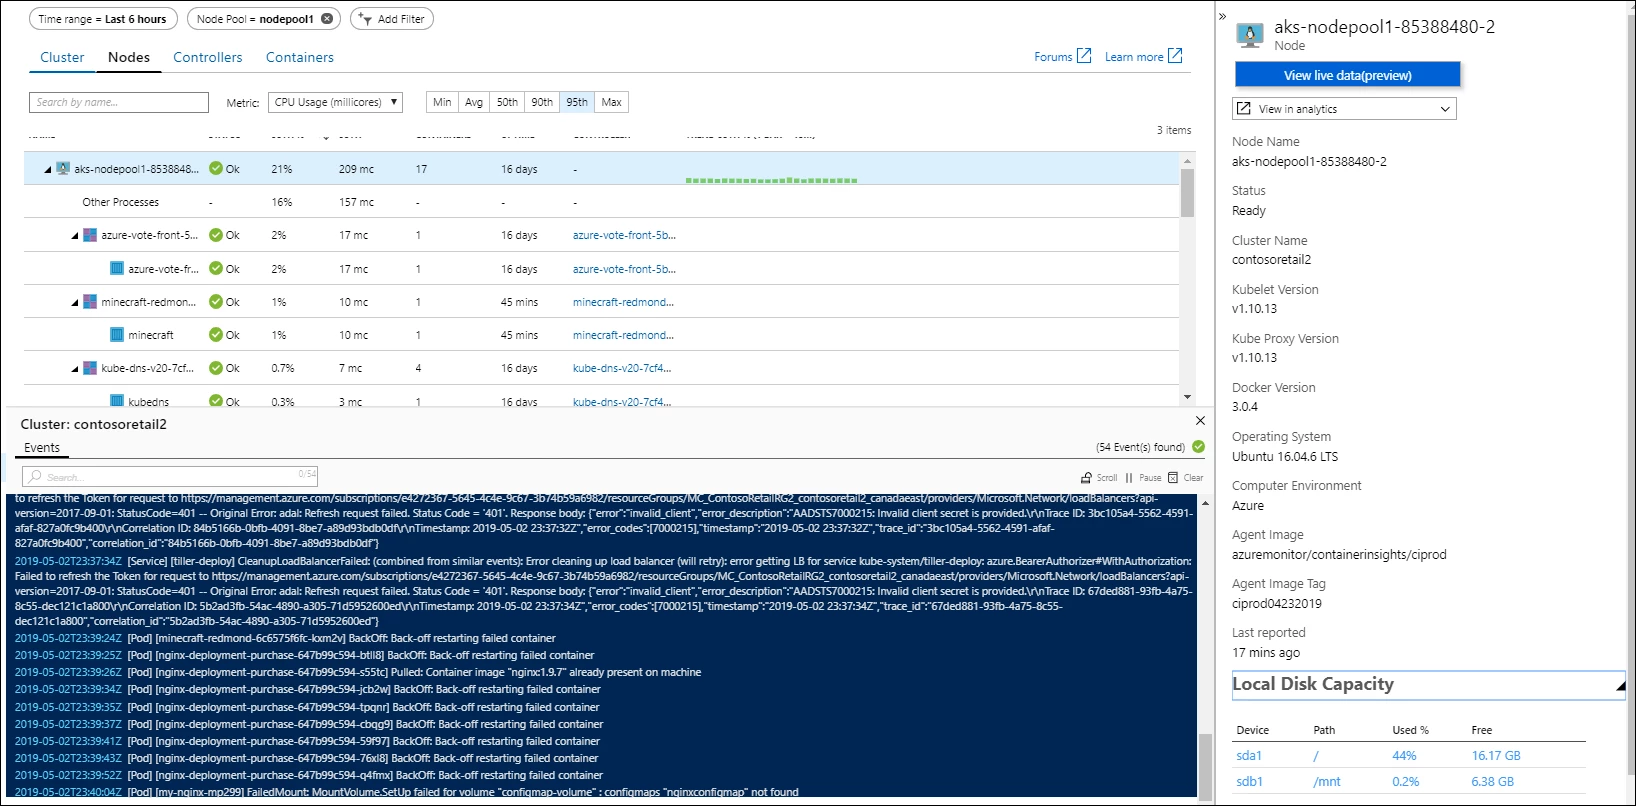
For monitoring your applications running on AKS, you can just instrument with Application Insights SDKs, but if you cannot instrument your workloads (for example, you may be running a legacy app or a third party app), we now have an alternative that doesn’t require any instrumentation! Application Insights can leverage your existing service mesh investments, the preview currently supports Istio, and provide application monitoring for AKS without any modification to your app’s code. This enables you to immediately start taking advantage of out-of-the-box capabilities like Application Map, Live Metrics Stream, Application Dashboards, Workbooks, User Behavior Analytics, and more.
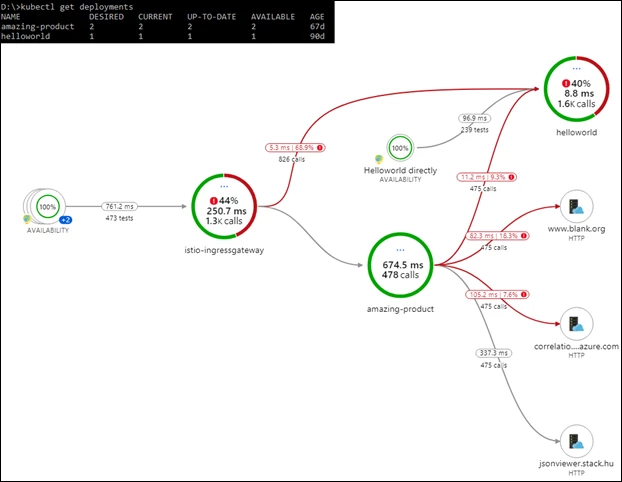
Through a combined view of application and infrastructure, Azure Monitor now provides a full-stack monitoring view of Kubernetes clusters.
Integrated access control for logs
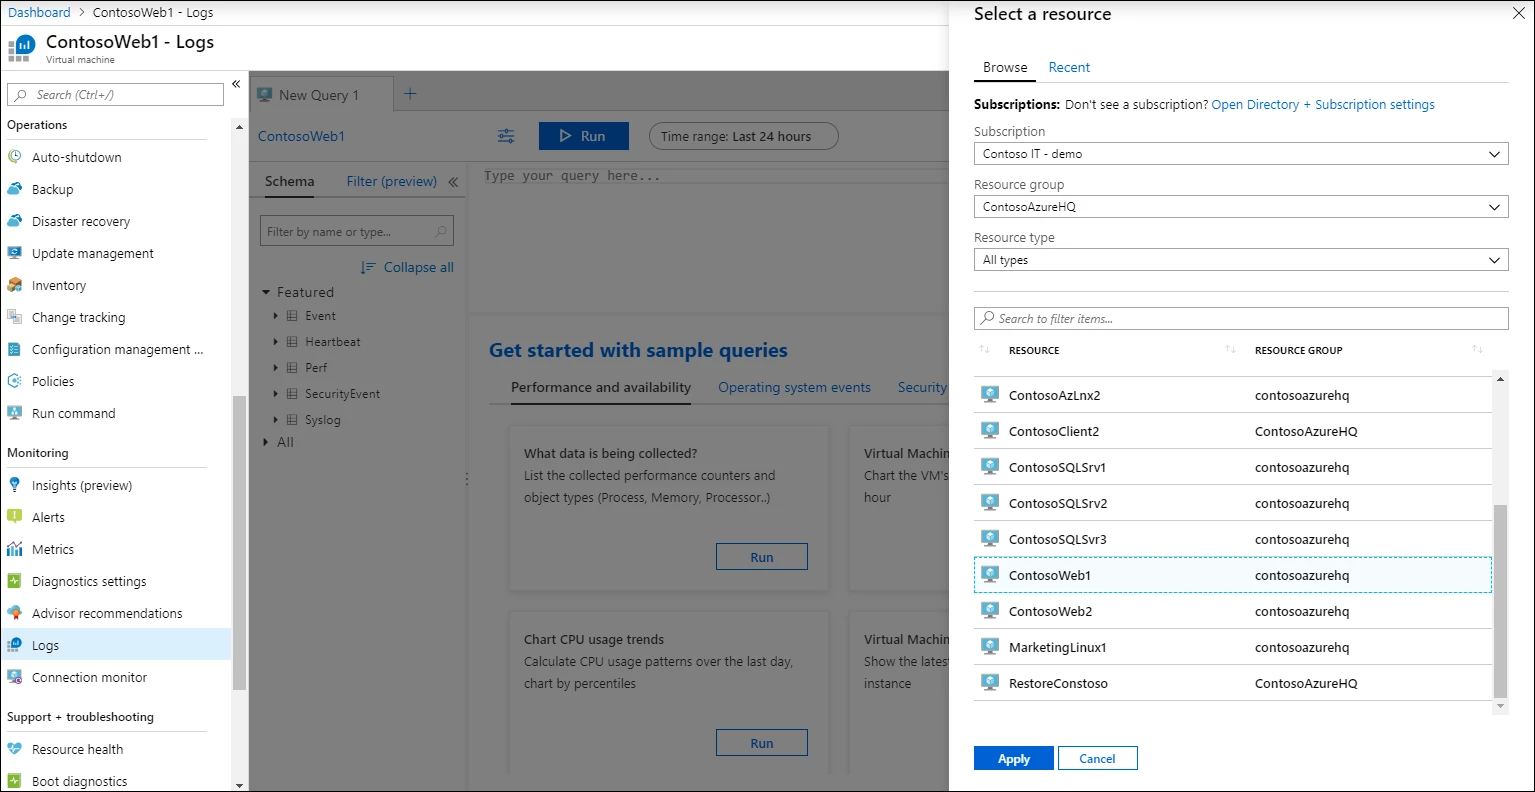
Azure Monitor is the central platform for collecting logs across monitoring, management, security, and other log types in Azure. Customers love the powerful, embedded Azure Monitor Logs experience that allows you to run diagnostics, root-cause analysis, statistics, visualizations, and answer any other ad-hoc questions. One of the challenges that customers were facing was configuring access control based on a resource. For example, how do you ensure that anyone who has access to virtual machine (VM) also has access to the logs generated by the VM. In line with our vision to provide you a seamless and native monitoring experience, we are now providing granular role-based access control for logs that help you cascade the permissions you have set at a resource level down to the operational logs.

Users can now also access logs scoped to their resource, allowing them to explore and query logs without needing the understand the entire workspace structure.
Intelligent and scalable alerts
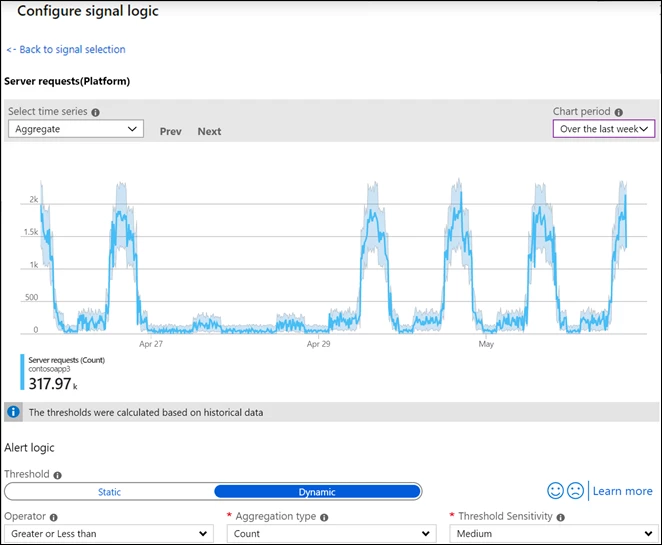
Metric Alerts with Dynamic Thresholds, now generally available, enables Azure Monitor to determine the right thresholds for alert rules. Multi-resource alerts makes it easy to create a single alert rule and apply across multiple VMs.
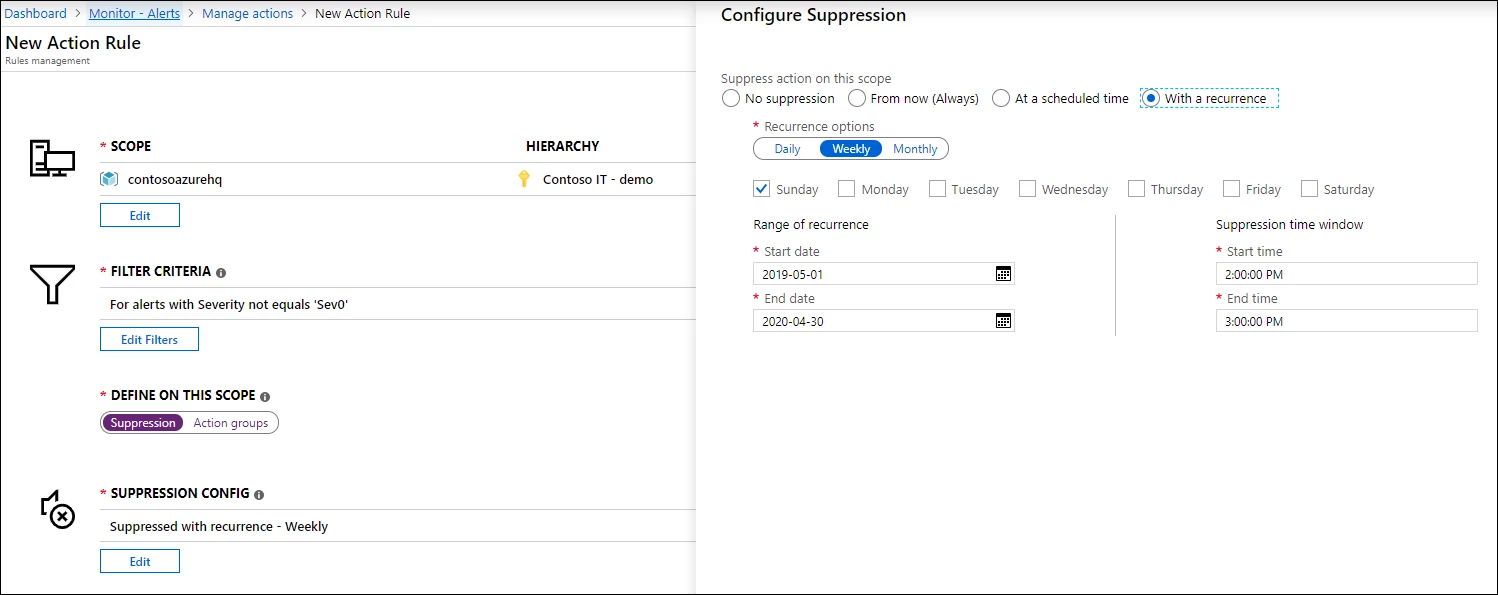
The new Action Rules, available in preview, add more flexibility and finer controls for Action Groups. Action Rules makes it easy to scale Actions Groups or suppress alerts during a maintenance window.
We shared three examples of how we are making Azure Monitor integrated, intelligent, and scalable, but that’s only a part of the story. Here is a list of other exciting announcements coming to you from Build.
- Preview of Azure Monitor application change analysis, providing a centralized view and analysis of changes at different layers of a web app. The first iteration of this feature is now available in the App Services Diagnose and Solve Problems experience.
- Improved visualizations in Application Map with better filtering to quickly scope to specific components, and ability to group/expand common dependencies, including Azure Functions v2.
- Improved codeless instrumentation experience for ASP.NET apps on IIS with the preview of Status Monitor v2. This enables clean redeployments, the latest SDKs, support for TLS 1.2, offline install support, and more!
- Application Insights SDK for Java workloads now fully supports W3C and provides monitoring support for Async Java apps with manual instrumentation API. Improved ILogger logs collection support for .NET Core apps and support for Live Metrics Stream for Node.JS apps.
- Workbooks are now first-class citizen for Azure Monitor and available in the main menu. Use the sample templates to customize interactive reports or troubleshooting guides with rich text, analytics queries, metrics, and various parameters across your apps and infrastructure resources! New templates also available supporting Azure Monitor for VMs to monitor open ports and their connections.
Get monitoring
Azure Monitor is constantly evolving to discover new insights and reduce potential issues with applications. Find the latest updates for Azure Monitor in the Azure portal. We want to hear from you! Ask questions or provide feedback.
Ready to get started?
